
Unlocking the intricacies of fusion representations is crucial for understanding the impact of complex genetic rearrangements on gene function and disease development.
In the most recent release of VarSeq, we added support for the import of complex rearrangements from VCF files, which typically encode rearrangements using breakend notation. This powerful notation is capable of describing the full spectrum of structural variation. This includes the following mutation types:
- Duplications
- Deletions
- Translocations
- Inversions
- Complex Rearrangements
In this format, a rearrangement is defined as a pair of novel adjacencies, called mates, which are linked by their position and id. Each breakend’s ALT field specifies the alternate sequence t, along with the position, p, and the orientation of the joined sequence as follows:
- t[p[ → piece extending to the right of p is joined after t
- t]p] → reverse complemented piece extending to the left of p is joined after t
- ]p]t → piece extending to the left of p is joined before t
- [p[t → reverse complemented piece extending to the right of p is joined before t
Now that we’ve described the basics of VCF breakend notation let’s take a look at a few specific rearrangements described using this notation and walk through the process of evaluating each rearrangement’s effect on the overlapping transcripts.
Example Duplication
Below we have a breakend pair describing a duplication in chromosome 3:
| #CHROM | POS | ID | REF | ALT | INFO |
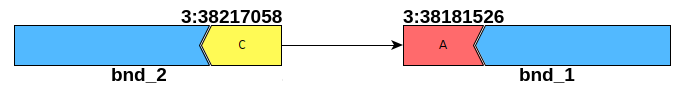
| chr3 | 38181526 | bnd_1 | A | ]3:38217058]A | MATEID=bnd_2 |
| chr3 | 38217058 | bnd_2 | C | C[3:38181526[ | MATEID=bnd_1 |
As we examine the notation, we see that the piece extending to the left of position 3: 38,217,058 is joined before the nucleotide A at position 3: 38,181,526, as illustrated by the diagram below:
From this, we can infer that the event is a duplication of the region 3: 38,181,526 – 38,217,058, which partially overlaps the genes MYD88 and OXSR1. The effect of this duplication is illustrated in the figure below:
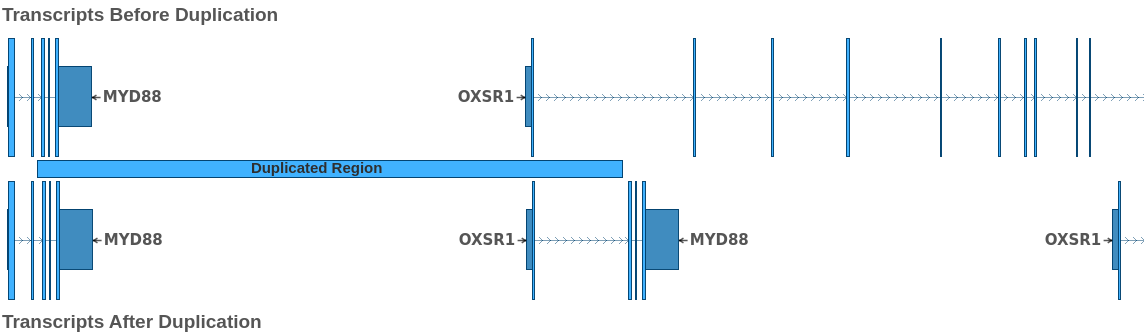
At the top of the figure, we see the transcripts prior to the duplication event, and at the bottom, we see the state of the involved transcripts after the duplication. From this figure, we can see that the duplication results in a OXSR1::MYD88 fusion. Because both breakends are intronic, we must zoom in on the boundaries of the joined exons to determine the effect of the fusion on the reading frame of the fused transcripts.

Looking at the image above, we can see that the reading frame is preserved, as the first nucleotide of the joined codon in OXSR1 is joined with the last 2 nucleotides of the corresponding codon in MYD88. Thus, the breakends in the VCF describe a duplication that produces an in-frame fusion of the OXSR1 and MYD88 genes. Upon further examination, we see that this fusion preserves the first exon of OXSR1 and exons 3-5 of MYDD8, preserving around 50% of the coding bases of the MYD88 transcript.
Inversion Example
In the next example, we will be looking at the following four breakend pairs:
| #CHROM | POS | ID | REF | ALT | INFO |
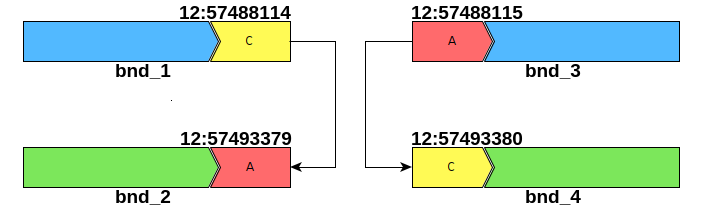
| chr12 | 57488114 | bnd_1 | C | C]12:57493379] | MATEID=bnd_2 |
| chr12 | 57488115 | bnd_3 | A | [12:57493380[A | MATEID=bnd_4 |
| chr12 | 57493379 | bnd_2 | A | A]12:57488114] | MATEID=bnd_1 |
| chr12 | 57493380 | bnd_4 | C | [12:57488115[C | MATEID=bnd_3 |
If we examine the above notation, we see that the reverse complemented piece extending to the left of position 12: 57,493,379 is joined after the nucleotide C at position 12: 57,488,114. Conversely, the reverse complemented piece extending to the right of position 12: 57,493,380 is joined after the nucleotide A at position 12: 57,488,115. This is illustrated in the diagram below:
From this, we can infer that these four breakends describe a single inversion spanning the region 12: 57,488,115 – 57,493,379. This region overlaps the genes NAB2 and STAT6. The effect of this inversion is illustrated in the figure below:
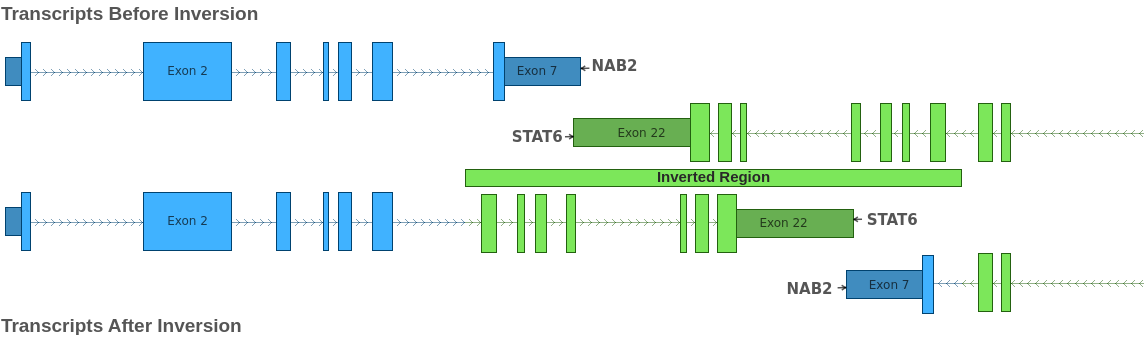
By examining the figure above, we can see that the inversion results in two separate gene fusions: NAB1::STAT6 and STAT6::NAB1. As with the previous example, we can examine the boundaries of the joined exons to determine the effect of the fusion on the reading frame of the fused transcripts. In this case, both transcript fusions preserve the reading frame. Thus, the four breakends in the VCF describe a single inversion that introduces two in-frame fusion events: NAB1::STAT6 and STAT6::NAB1.
Conclusion
These examples illustrate the complexity involved in reasoning about rearrangements described using VCF breakend notation. Thankfully, VarSeq reduces this complexity by automatically joining mate pairs and inferring the type of each rearrangement on import. Additionally, the VarSeq gene annotation algorithm identifies all possible fusion gene pairs and predicts the effect of each fusion on the protein product for the clinically relevant transcripts. The output of VarSeq’s gene annotation algorithm for the example inversion described in the previous section is shown below.

The first example presented in this blog post illustrated how CNVs can be described using breakend notation. In these cases, the CNV events are imported into both the Breakend and CNV tables so that they can be annotated and interpreted in either context. If you have any questions about breakend support in VarSeq, please don’t hesitate to contact us at support@goldenhelix.com.