Genomic data visualization is an extremely powerful means to help users comprehend massive amounts of sequencing data and is valuable for communicating genomic information and findings. Genome browser tools allow users to visualize aligned sequence data in BAM format, map the data to a reference assembly, view annotation tracks, genomic region tracks, export graphics for sharing, and much more. Genome Browse is VarSeq’s built-in genome browser tool, and it is packed with useful features. Genome Browse is also available from Golden Helix as a free stand-alone tool. This blog post will delve into some of the features for variant visualization in VarSeq’s built-in genome browser.
Users typically start Genome Browse by using the Plot option from the VarSeq main menu in the top left of the project window (Figure 1). From this menu, users have the option to plot their BAM files, variants in the current sample (or in all samples), fields, and annotations. Plotting variants pulls in the genotype field and shows a visual of your variant mapped to its chromosomal location. Plotting the BAM visually depicts the read depth coverage and raw read pile-up across sequenced regions.

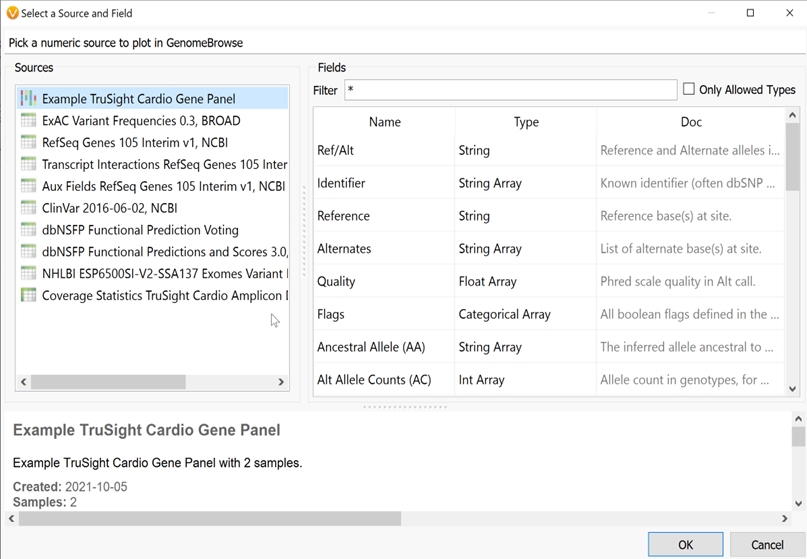
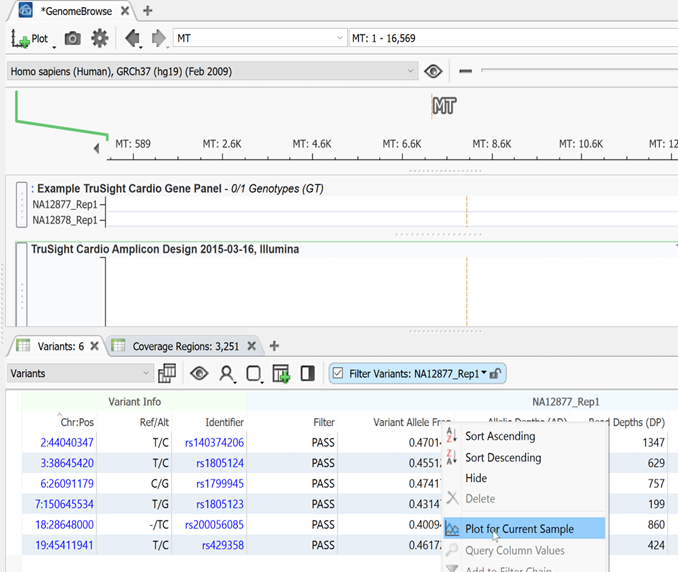
By selecting Plot field from the Plot menu, a user can plot any field in their variant info from the variant table or any annotations that have already been added to their variants. This same function can also be achieved by right-clicking on a field in the variant table and clicking Plot for the current sample (Figure 2).
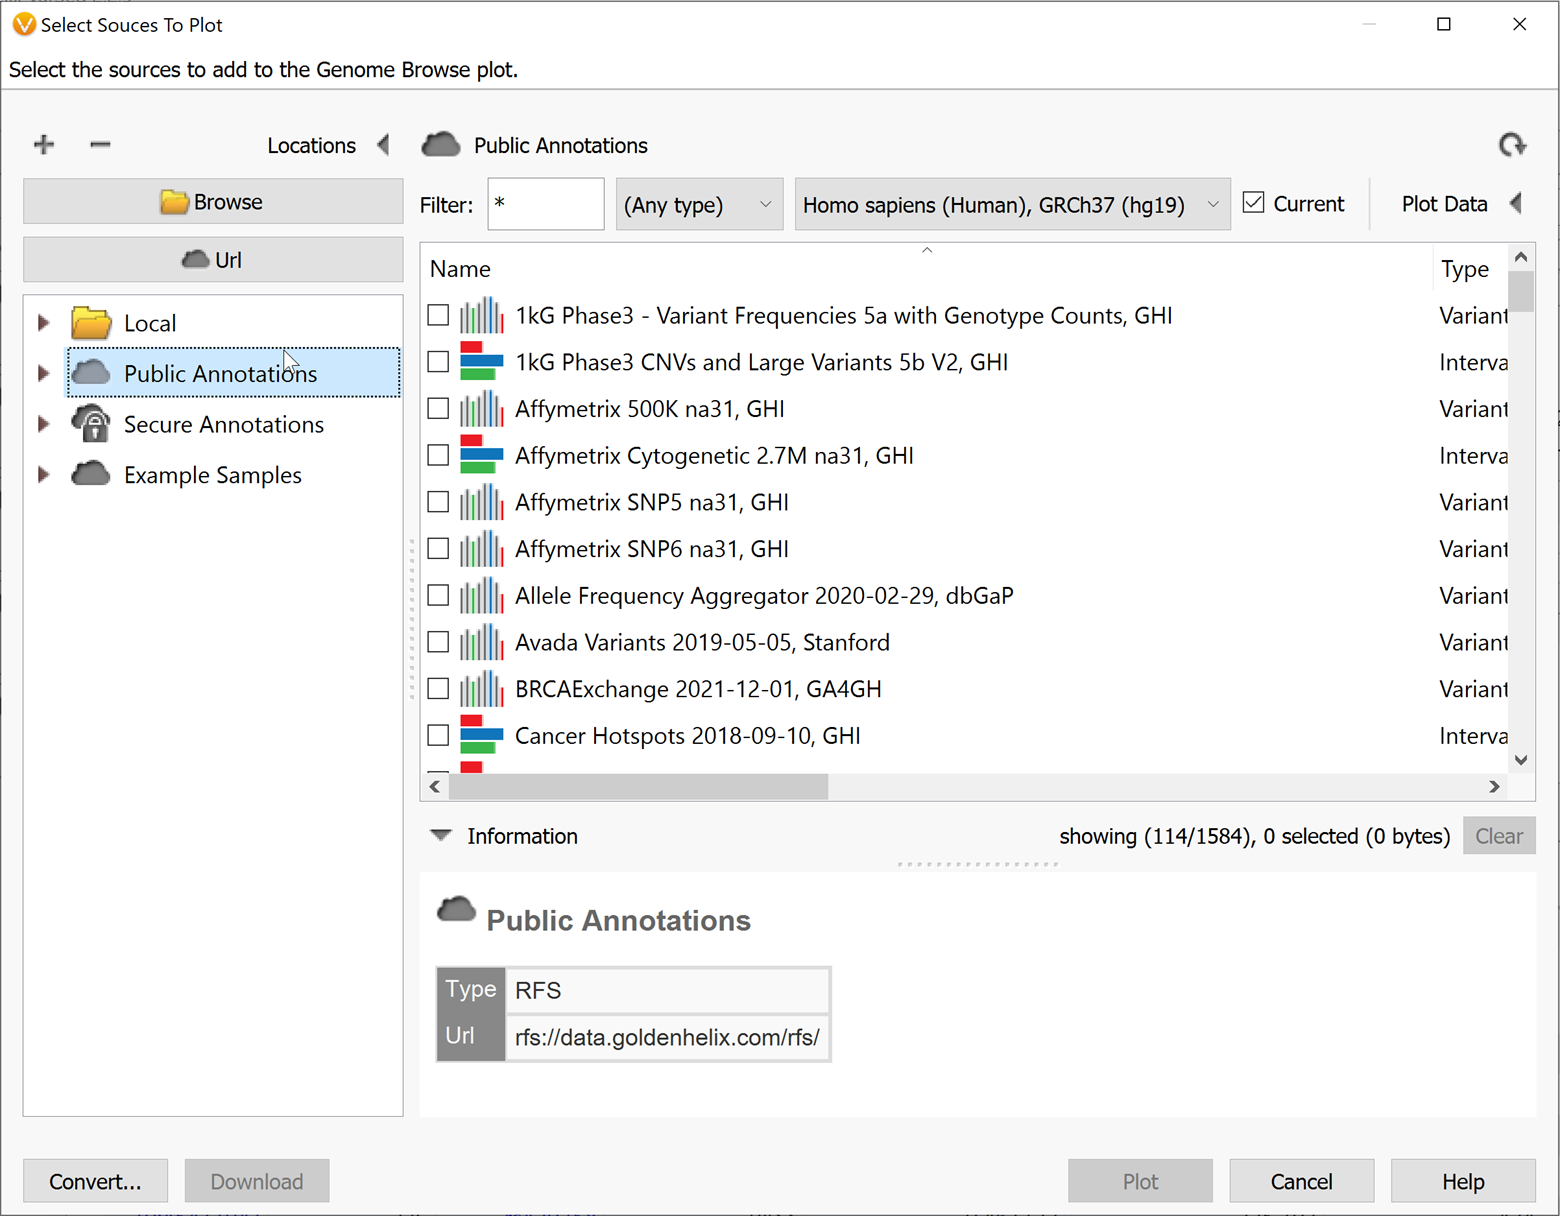
You can also plot databases or annotations that are in the Golden Helix annotation server or your local annotation folder by using Plot Annotation.
Genome Browse can also be accessed by clicking on any + icon next to an open tab in VarSeq. By default, a visual representation of the chromosomal location is plotted (Figure 4). A segment of chromosome 2 is displayed below, but a user can type in a specific location to search or select a chromosome from the drop-down menu, or click on a variant in the variant table to be brought to that variant’s location.
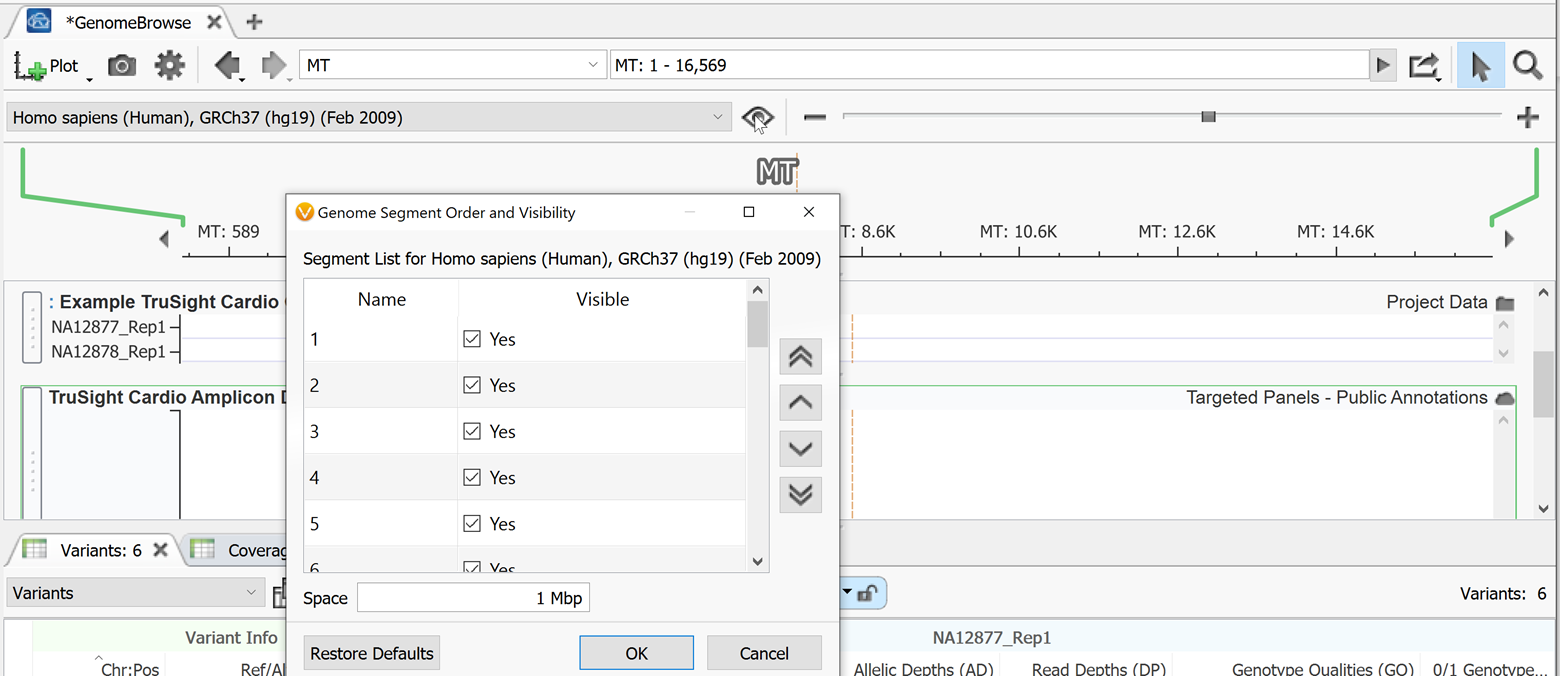
Above the chromosome graphic, the genome build is displayed along with an eyeball icon which when clicked breaks down the chromosomes existing in that build for that species.
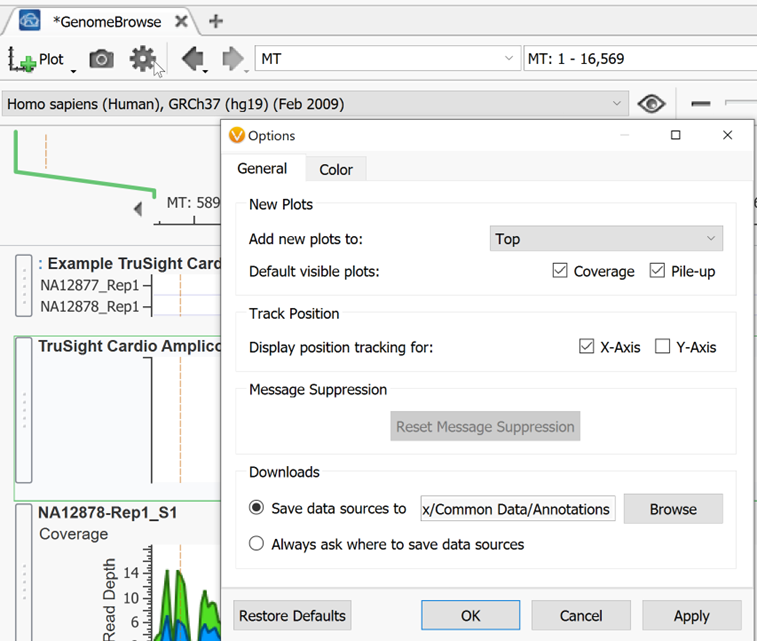
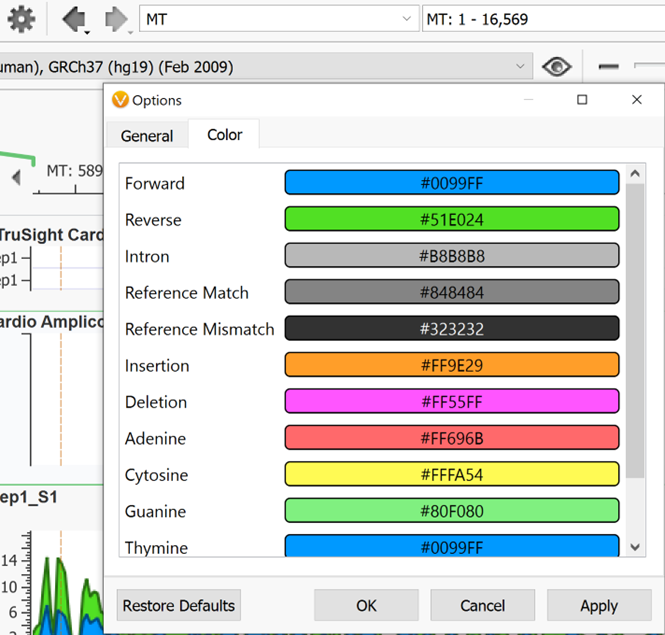
To the right of the eyeball in Genome Browse is the zoom scroll bar. You can also zoom by using the magnifying glass to the right above the zoom scroll bar then highlighting a section on which you want to zoom in on. To select and move left to right instead of zooming when you click and drag within genome browse, switch to the pointer icon next to the magnifying glass. To the left of the pointer is a link out to an external genome browser or genomic region sites from NCBI, UCSC, and Ensembl. The search bar to the left of this can be used to jump to any desired chromosomal location as mentioned above. The back and forward arrows are used to go back and forth between the previous views that a user had been looking at in Genome Browse. To the left of those arrows is the Settings icon shaped like a gear. The default settings of Genome Browse can be adjusted here.
Want to experience GenomeBrowse?
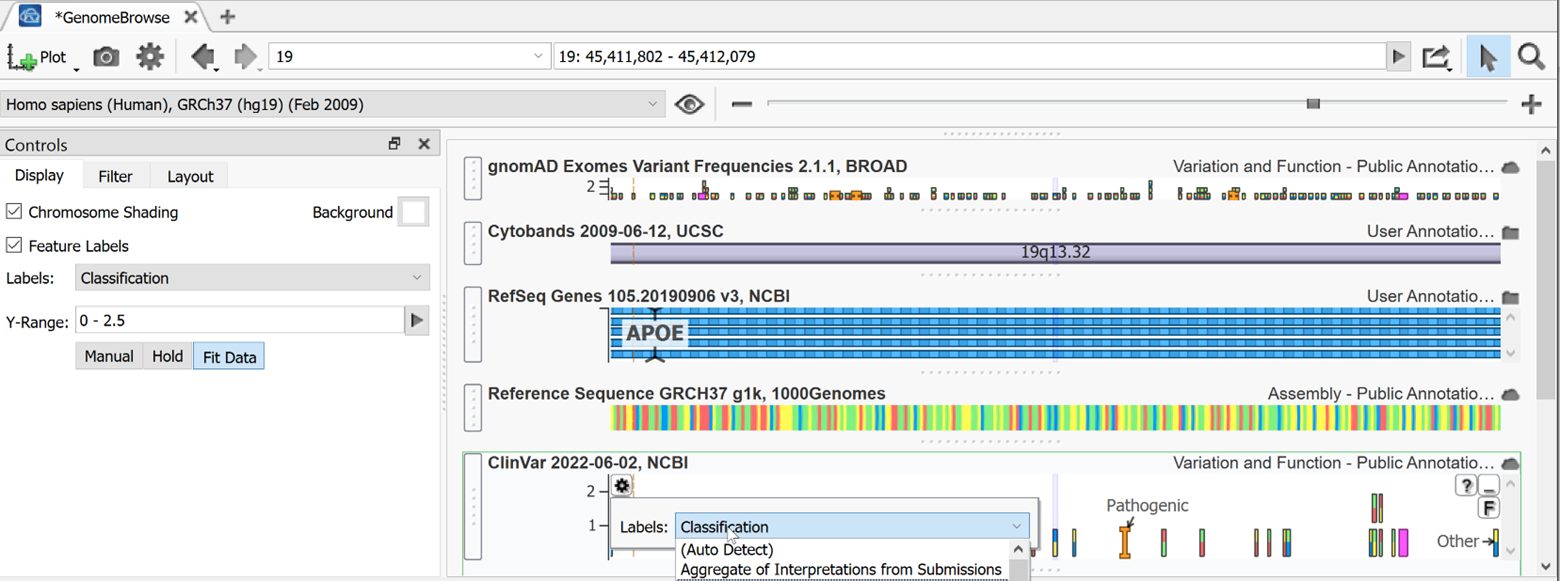
The Plot menu inside Genome Browse is full of useful shortcuts. Plot new source allows you to plot annotations in the same fashion as Plot annotation option discussed above. For example, below, the ClinVar track (also available for quick plotting as a common source) has been plotted and this shows the reference and alternate designation for variants in this region that are found in the database. You can also use this option to plot a bed file displaying color blocks for the regions of interest in this project. Here we have also plotted cytobands, the hg19 reference assembly using Plot Reference, and the RefSeq gene track using Plot Genes. You can also update plotted tracks to the latest version from this menu.

Hovering over any panel will display a gear icon for settings and a Feature list. Using ClinVar as an example, you can use the Plot Options menu to change the labels displayed for your panel, or access More Controls to make additional changes to the display or layout. Here we changed the labels of ClinVar variants to classification instead of gene names.
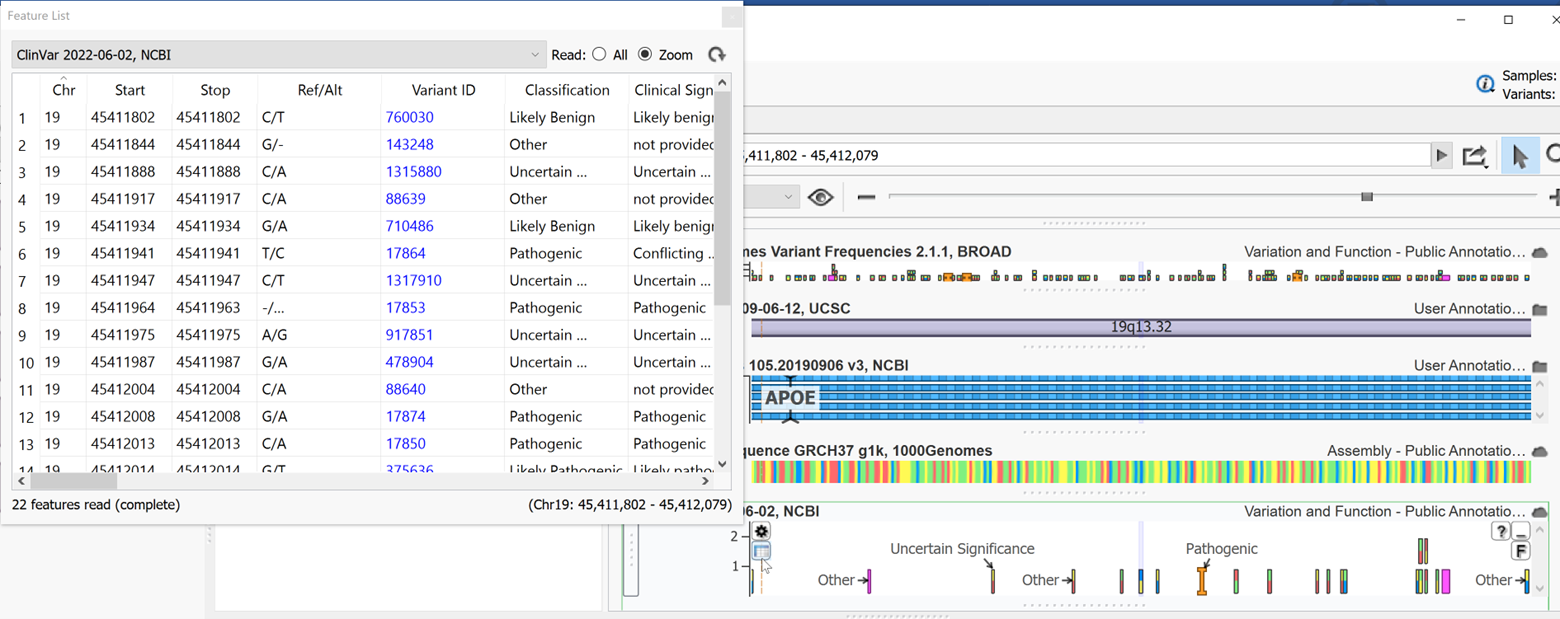
Using the feature list we can explore details from ClinVar and even copy the information for external use. Clicking on any column header will sort by that field in ascending order.
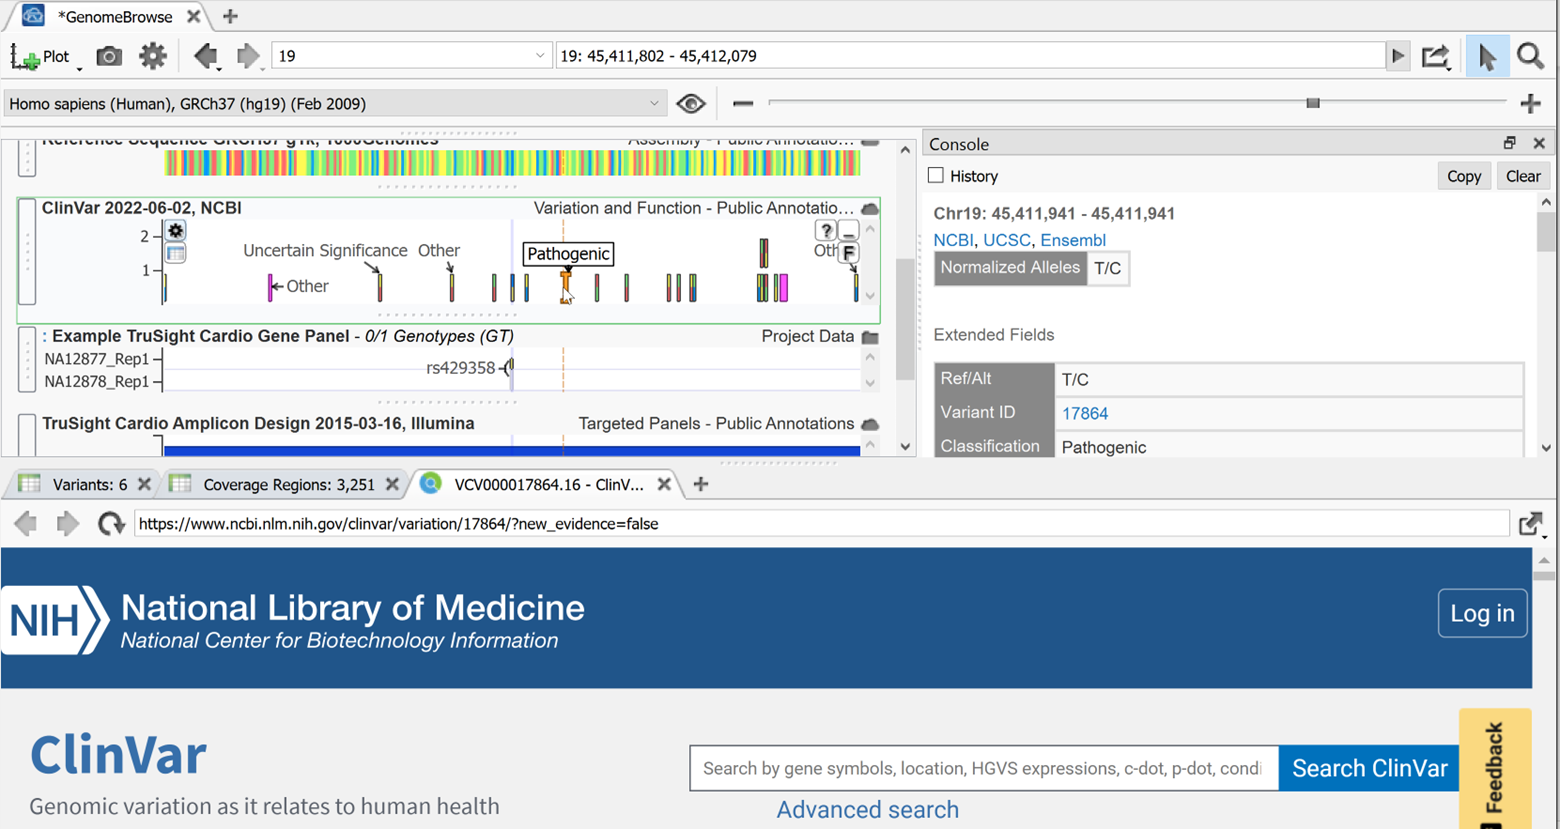
In addition to displaying variants and tracks, you can access a wealth of information right here in Genome browse. Licking on any color block or feature inside a panel will open a console on the right with detailed information on the feature that was clicked. Often, as is the case with ClinVar, this info will also have external links, which is great for research purposes. Clicking on these links will open them in our built-in web browser.
Of course, It is always great to share all the useful information you gather when using our genome browser. You can save this window as a photo using the camera icon.

Please take advantage of these features to get the most out of your variant visualizations in Genome Browse. Feel free to reach out to support@goldenhlix.com if you need any help with visualizing your genomic data.