Thank you to everyone who joined me for our latest webcast, “Next-Gen Sequencing of the SARS-CoV-2 Virus with Golden Helix.” If you missed the live event and are interested in knowing what we talked about, you may access the recorded event below:
Our Live Q&A generated a lot of great questions. Unfortunately, we were unable to answer them all, but we have compiled the frequently asked questions our audience asked.
Q: What data related to COVID-19 is shipped with your products?
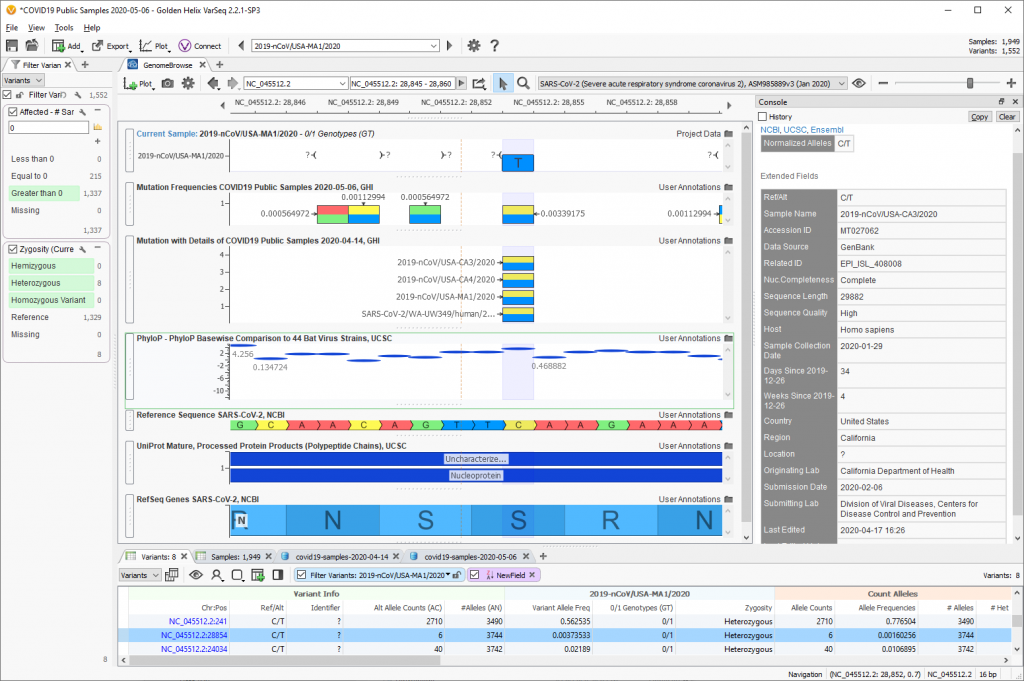
A: We curate the SARS-CoV-2 reference sequence and a number of additional annotations that can be used to evaluate the gene impact, conservation and frequency of mutations. These include
- Mutation Frequencies COVID19 Public Samples: Frequency of mutations in public sequences of SARS-CoV-2 patients with COVID19 from the China National Center for Bioinformation 2019 Novel Coronavirus Resource. Most public samples are published in GenBank. Counts and frequency of each variation detected is available as an annotation to improve filtering.
- Mutation with Details of COVID19 Public Samples: The same frequency data but with each sample with the variant represented as an annotation feature. The details about the sample collection date, submitting lab and city, state, and country that it was collected was provided. This is particularly interesting when variants are rare and the exact details of the few samples with a given variant can be investigated.
- PhyloP Basewise Comparison to 44 Bat Virus Strains: This track shows multiple alignments of 44 virus sequences, aligned to the SARS-CoV-2 reference sequence. Positive values indicate conservation when compared to these ancestral viruses, negative values indicate fast-evolving loci.
- UniProt Mature, Processed Protein Products (Polypeptide Chains). This track shows protein sequence annotations from the UniProt/SwissProt database, mapped to genomic coordinates. The data has been curated from scientific publications by the UniProt/SwissProt staff.
- RefSeq Genes SARS-CoV-2. This track contains RefSeq Gene transcripts annotated by the SARS-CoV-2.
Q: Is some of the work that you referenced with collaborators published?
A: Yes, you can find a recent article written by our CEO, Dr. Andreas Scherer, in the Clinical Lab Manager here referencing this work. If you are looking for a longer read, you can download our latest eBook “Genetic Testing of the COVID-19 Virus and Other Pathogens” here.
Q: How often will you update annotations?
A: We expect to be updating SARS-CoV-2 monthly as it is changing quickly.
Q: Can I run this type of analysis on my own clinical samples that I can not share or upload to the cloud?
A: Yes, all analysis can be conducted on-premise and does not require sharing.
Q: Is there any limitations on how many samples I can run at any given time?
A: From a business perspective, we are not charging by sample. With an active license of our software, we want you to be able to work on as many samples as you need without worrying. As your lab scales up the sample workload, our pipeline tool can process a large number of samples on a single server in an automated fashion. Should that not be sufficient, we can run on a cluster configuration for very high throughput use cases.
Q: Can we run a genotye-phenotype association through the software of Viral DNA?
A: Absolutely! Integrated into SNP & Variation Suite are multiple options for running association tests. Users can select dependent variables such as phenotypes or other sample attributes that are imported and merged with sample genotypic data.
Q: How open you are with the collaborations over COVID-19 projects?
A: We would be delighted to collaborate with customers in this space! Our goal is to provide the best research and clinical experience possible for relevant genomic analysis workflows. We work closely with our customers who are pushing the bounds on the state of the art and have had many successful collaborations in the past that have resulted in innovations and learnings that get integrated back into our products to the benefit of all of our customers. We look forward to hearing from you!
Q: Is it possible to do phylogenetic analysis with SVS?
A: Phylogenetic trees are a form of hierarchical clustering usually performed between viral species sequences to compare their evolutionary distance. SVS supports a similar type of hierarchical clustering more suited to the analysis of samples within the same viral species (SARS-COV-2). This analysis is available through the dendrogram feature demonstrated in the webcast. Clusters are computed using configurable distance metrics (Euclidean suggested) along both the sample and variant dimension to understand the similarity of samples to each other and between groups (in the cluster hierarchy) and which variants segregate with the clusters.
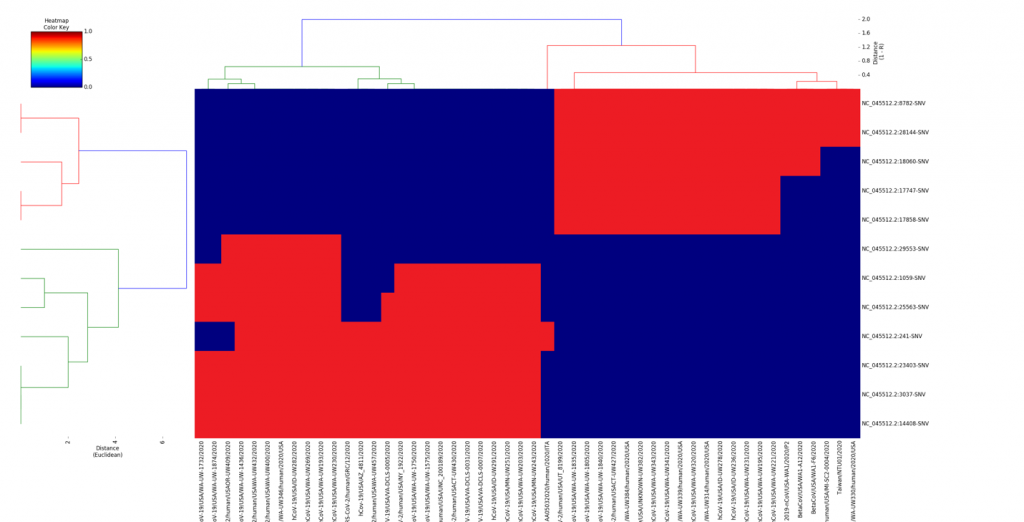
Q: What do you think are represented by the three different linear type cluster?
A: Great question! The next stage of our analysis in this project will be to explore the shared and unique alleles between each of the clusters and to compare this among even more public samples coming through in the future. We’re working to report the findings in an upcoming publication so stay tuned! At a mathematical level, the samples within a same cluster have eigenvalues computed from the entire genome variant set. This comprehensive view of a samples relationship to each other may provide insight into the virus evolving into identifiable strains as it spreads globally and mutates over time.
Q: In the 3D PCA plot there was 4 clusters. What does that data imply?
A: The goal is to now profile these clusters to determine if they share any unique sets of alleles. This process would be carried out for the fourth cluster as well to see if maybe a separate divergent group from the original COVID outbreak point occurred. Fortunately, the combination of SNP & Variation Suite and VarSeq makes this a simple task. One paper used as a reference for profiling these allelic groups can be accessed here.
I hope you found this to be useful in learning more about how Golden Helix’s NGS solutions can be leveraged in the fight against SARS-CoV-2. This webcast is one of many COVID-19 resources we have made available for our community, you can find the others at bit.ly/covid19ghi.
If you are interested in seeing a more personalized demo for your organization, please reach out to our team and we will be more than happy to schedule a call with you. Or, if you have any additional questions not covered here, please enter them down below!