Recently, we were excited to find a new example data set for cancer gene panels. We have included this example data in the latest e-book by Dr. Andreas Scherer, Genetic Testing for Cancer as well as in the latest cancer webcast . This data is from Illumina’s MiniSeq sequencer and the TruSight Cancer panel. The BAM and VCF files for three samples (2 replicates each) were obtained from BaseSpace’s Public Data and the variants were called using the Issac Enrichment v2.1.0 BaseSpace App.
The cancer gene panel workflow example takes the variants from all six samples and after applying quality filters to remove suspect variant calls, it filters the variants down to a short list of possible somatic mutations associated with cancer. From here, three oncogene mutations are identified and a clinical report is automatically generated. This report can be exported as a PDF and included in an electronic medical record, or shared as an HTML.
To reproduce the example featured in the e-book, download the zipped example project.
This data can also be accessed through VarSeq’s Public Data repository. To download or access the full BAM and VCF files, from VarSeq go to Tools > Manage Data Sources and select them from the Example Samples > MiniSeq TruSight Cancer.
The VCF files for all 6 samples with replicates contained 140,714 variants. In order to quickly filter down to actionable variants associated with the individual’s cancer, VarSeq uses various filters in a workflow. For this particular example, the workflow features three parts.
First, variants in the regions targeted by the panel will be identified. As reads can align anywhere on the genome, they can align to regions not targeted by the panel. These reads should not be considered as the panel will not have the power to detect a true signal outside of the targeted regions.
Second, variants will be filtered to remove low quality variants. In order to make an actionable decision on treating a cancer, you will want to make sure you are basing that decision on the highest quality data available with enough reads to support the presence of the mutations. We will remove variants that the variant caller deemed low quality, variants with a low read depth as well as variants with an alternate allele frequency less than 5% which is the minimum threshold for calling a variant with the TruSight Cancer Panel (see Illumina’s application note for the variant detection parameters).
Finally, we will focus on variants that are known cancer mutations by only considering variants found in the COSMIC database and those that have a predicted loss of function or missense effect on the transcript.
Let’s walk through how this workflow looks in VarSeq. If you open the example project in VarSeq you will see three distinct views (or tabs) in the window. We are first going to focus on the Cancer Panel Workflow view in the upper left corner. Labeled “1” in Fig. 1.
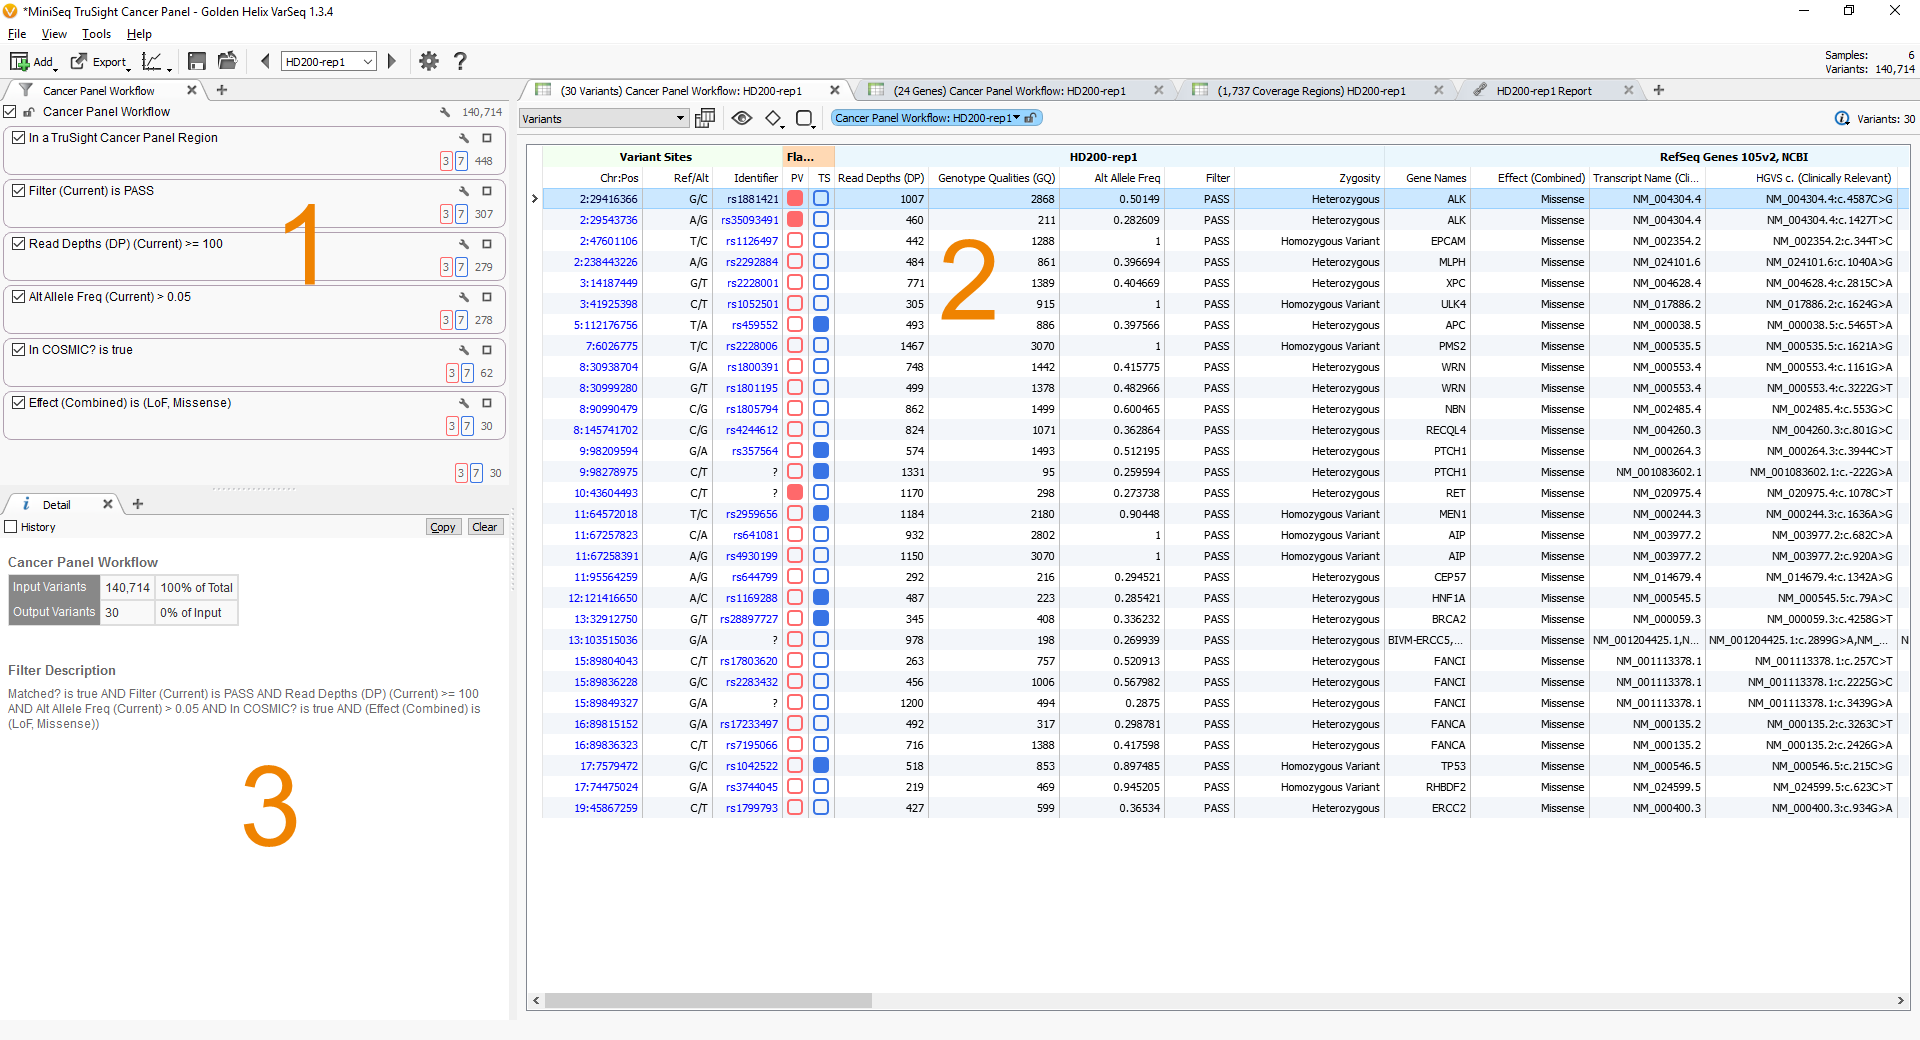
Fig. 1. Map of VarSeq Views
If we look closer at this view we can see the filtering actions described above. (See Fig. 2.)
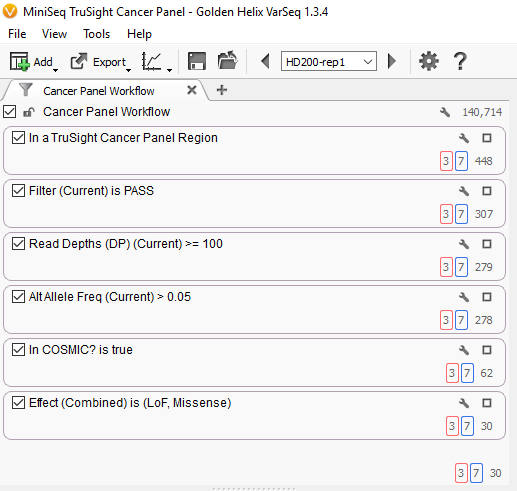
Fig. 2. VarSeq filters and cancer panel workflow
The first box at the top describes the filter to remove all variants found outside of the targeted regions. This reduces the number of variants from 140,714 to only 448.
The next three boxes describe the quality control filters, first filtering to keep only variants with a status of “PASS” a category assigned by the variant caller, next keeping only variants with a read depth of greater than or equal to 100, finally keeping only variants with an alternate allele frequency of greater than 5%. This reduces the number of variants to 278 high-quality variants.
Finally, the next two boxes describe the filters to identify the potential somatic mutations, first by identifying those present in the COSMIC database, then by restricting the mutations to those with a loss of function or missense effect on the transcript. This leaves 30 variants. See Fig. 3.
In addition to the above filters, this workflow also annotates the data using two additional data sources including OMIM and OncoMD. OMIM is a catalog of gene, variant and phenotype data for mutations. OncoMD is an external database curated by MedGenome that contains current and ongoing clinical trials, functional validation of variants, drugs targeting known mutations and existing studies with the variants and more.
VarSeq allows the user to flag or select variants to be grouped in a specified category. In this example, there are two categories, the red category (In OncoMD oncogene) and the blue category (in OncoMD tumor suppressor gene). As you can see there are three variants in genes classified by OncoMD as oncogenes, two variants are in the ALK gene and one in the RET gene.
These 10 variants are summarized in a clinical report created by a template within the VarSeq software. See Fig. 4. View the report here.

Fig. 4. Clinical report for HD200-rep1 sample
If you have any questions about this example project or want to get a copy of VarSeq or VarSeq Viewer, please contact support@goldenhelix.com.