We recently hosted a webcast covering the value and application of VSWarehouse through VarSeq. Not only is VSWarehouse a solution for storing your NGS data in a central repository, but it also provides a means to enhance the tertiary analysis done in VarSeq. VSWarehouse will store all your sample/variant data but also stores your catalogs of pathogenic variants, clinical reports, and has the capability of filtering/querying on all your stored data quickly. In addition, VSWarehouse has an incredibly powerful API which allows for building custom integrations with other systems such as LIMs or EMRs.
The focus of this first part of a three-part blog will be to highlight the points of the webcast and demonstrate the application of VSWarehouse stored catalogs into a VarSeq CNV project. With any NGS-based CNV analysis, a major concern is the exclusion of false positive events. When we developed the CNV algorithm in VarSeq, we wanted to provide a means of prioritizing the true events. Helpful tools for this process are described in detail in some previous blogs. However, VSWarehouse takes this process to the next level by utilizing comprehensive cohort frequency data and consistent interpretations shared among multiple users simultaneously.
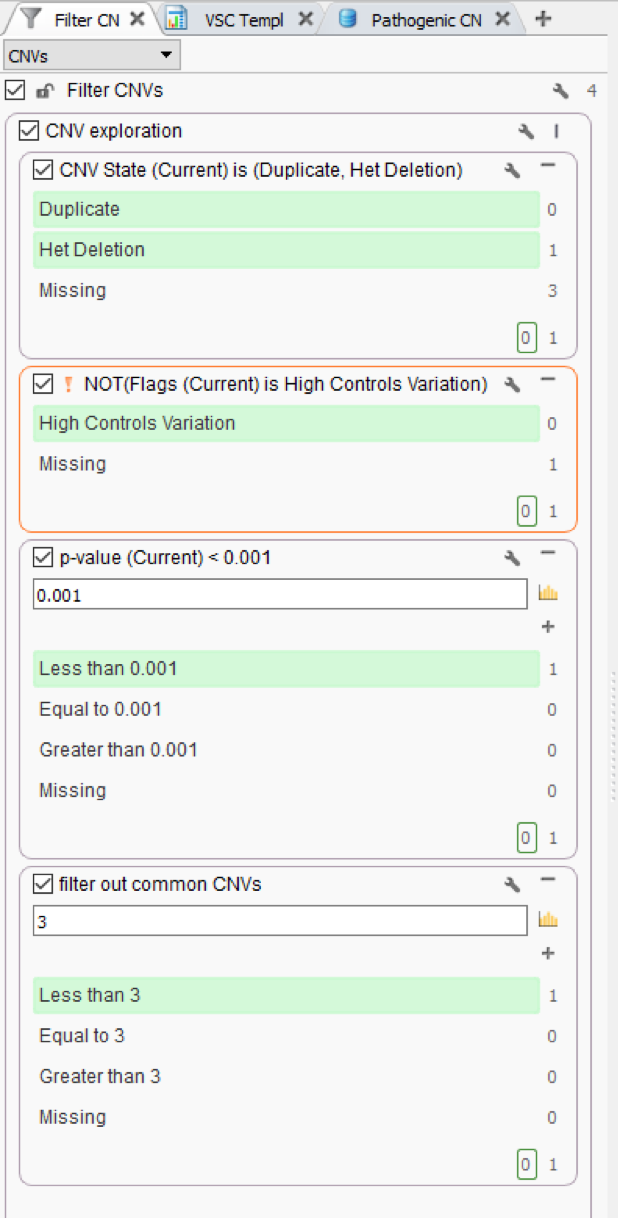
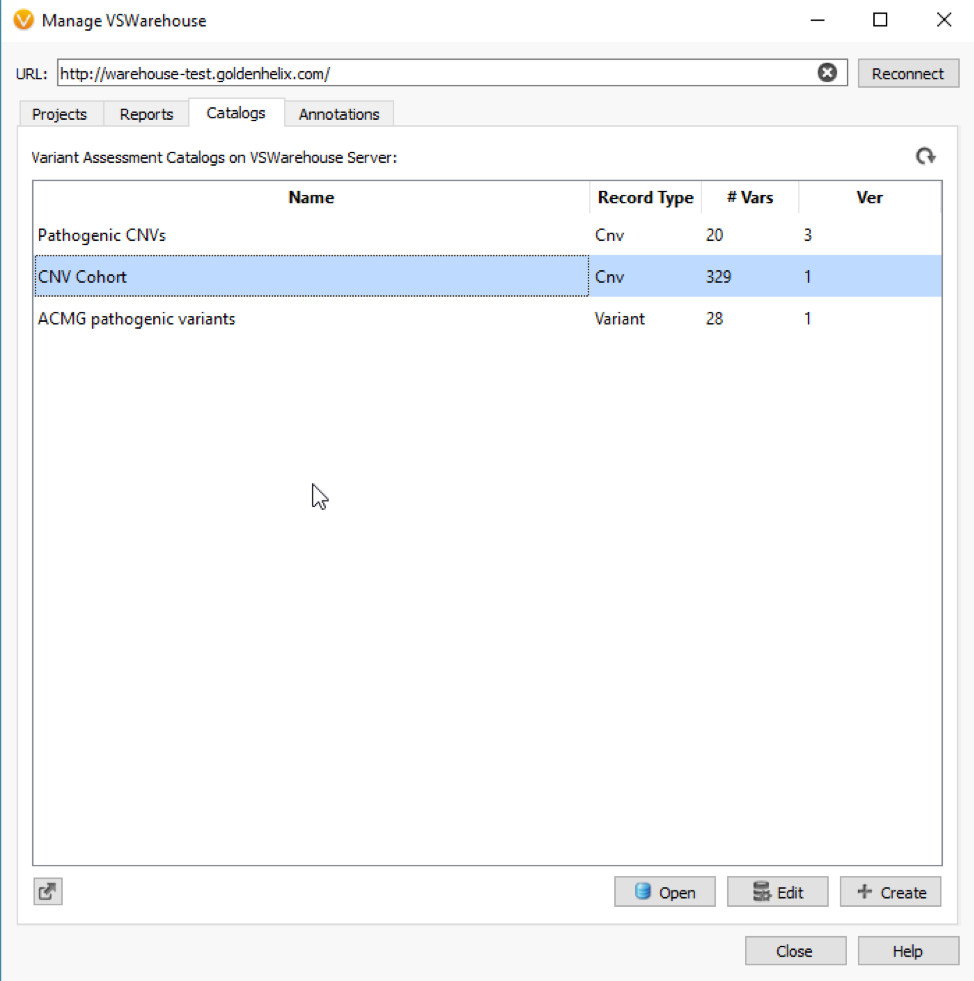
Figure 1 shows a simple CNV workflow that prioritizes CNVs for each sample (CNV State is Duplicate/Het Deletion), high quality events (No low-quality flag), of high confidence (p-value), and finally eliminates commonly seen CNVs. Commonly seen events may be an artifact of the secondary analysis process that produces the coverage information stored in the BAM file, which is the fundamental data source for VarSeq’s CNV detection. The CNV frequency criteria are based on a cohort of all CNVs detected and stored in an assessment catalog which resides in VSWarehouse (Fig 2).
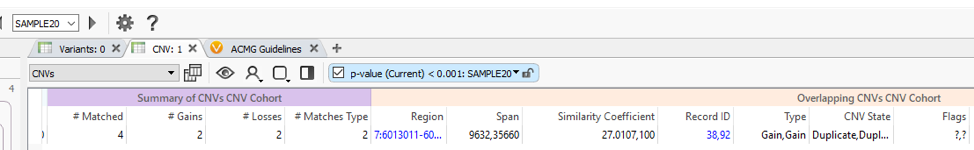
The VSWarehouse stored CNV Cohort catalog can be used as an annotation in the VarSeq projects. This is the prime example of one approach to have VSWarehouse optimize your variant analysis, by annotating against a cohort of variants and setting some threshold of common CNVs, prioritizing rare/novel events. When annotating against CNV results, you’ll see the #Matched field added to my CNV workflow in Figure 1 (Fig 3). In the CNV table, you’ll also notice the Similarity Coefficient, which is the level of overlap the detected CNV has with and region-based track annotation (i.e. format for recorded CNV events). Including the simple criteria #Matched into your workflow captures and excludes any detected CNV with any overlap with any cataloged event.
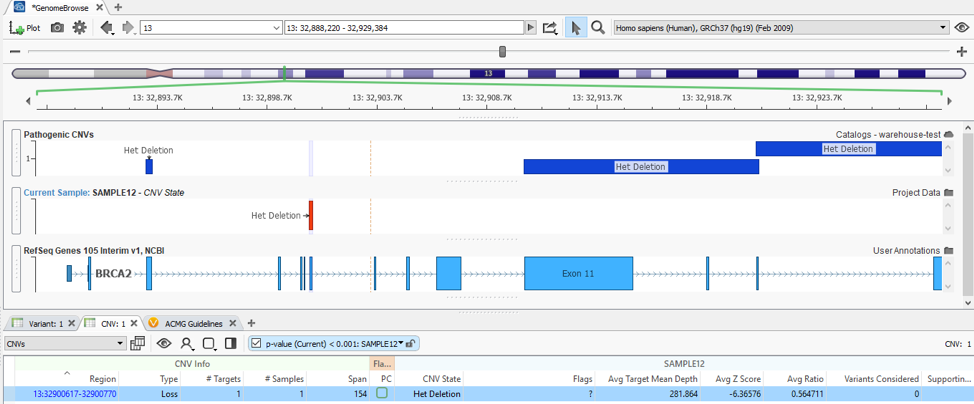
What about when a detected CNV doesn’t overlap with a recorded event, do the assessment catalogs still serve a purpose? The answer is absolutely, Yes! In addition to annotating with an assessment catalog in the variant table as seen in Figure 3, the user can also plot these catalogs in GenomeBrowse (Fig 4).
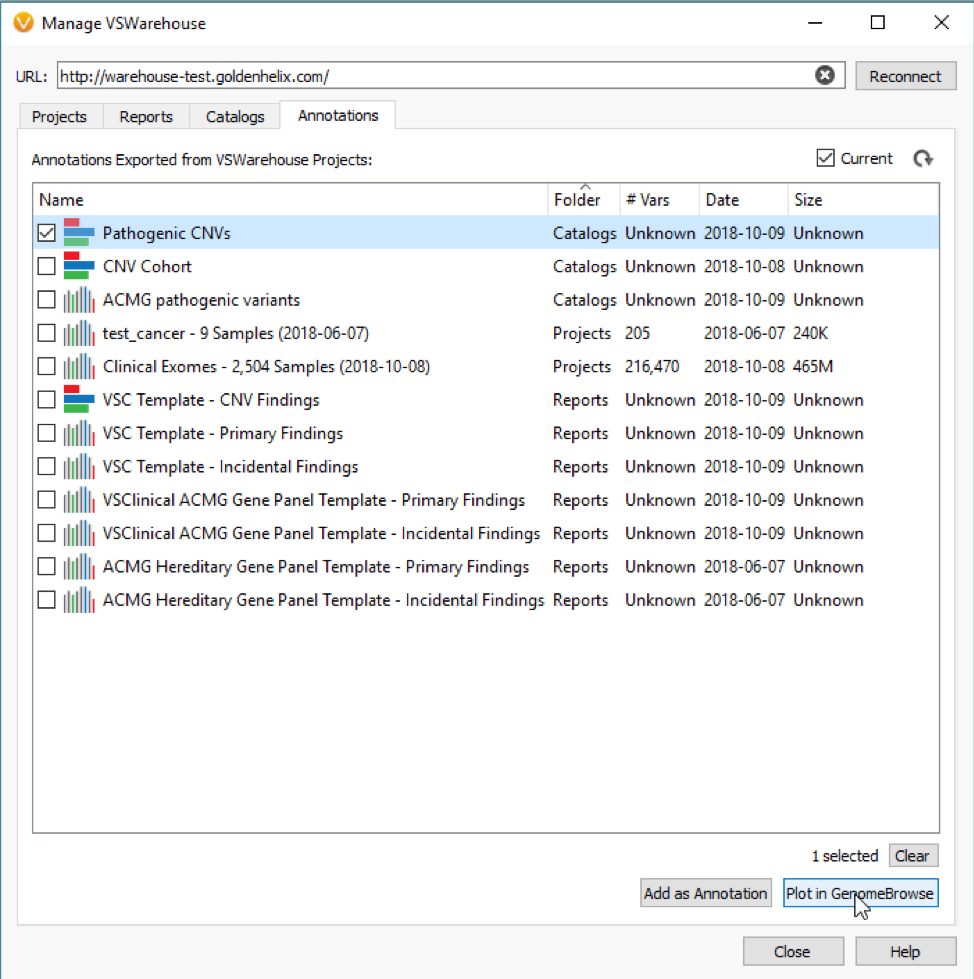
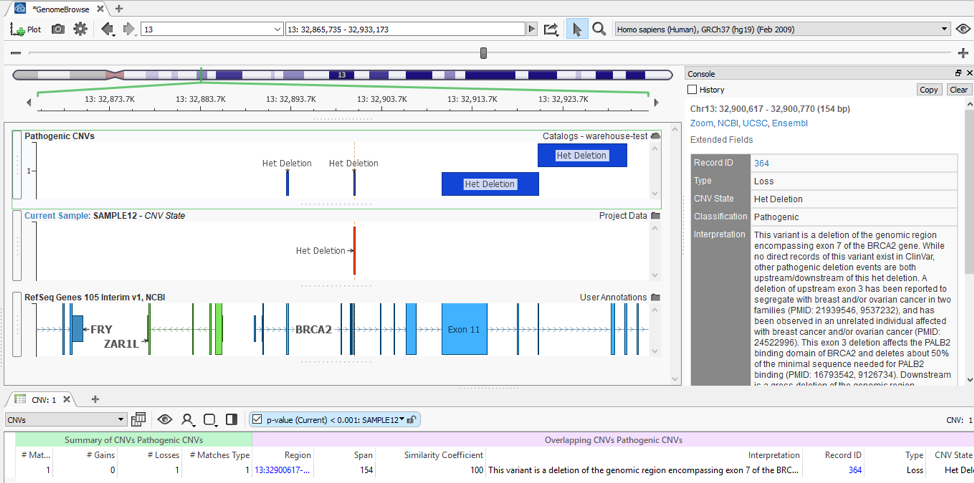
With my catalog of known pathogenic CNVs, I can gain a reference of whether my newly detected CNV lands in a gene with known pathogenic effects. You can see this demonstrated in Figure 5, where my detected heterozygous deletion of a single exon is in a gene (BRCA2) with other known pathogenic events previously recorded.
When recording an interpretation for any CNV/variant, the catalog automatically updates in
This was meant to be a brief overview of the value of new capabilities in VSWarehouse to leverage CNV events to help streamline analysis. Part 2 of this blog series will demonstrate the similar value with how VSWarehouse can optimize your analysis even more with individual variant interpretations through VSClinical. Stay tuned, and please feel free to reach out to Golden Helix support with any questions you may have.