Thank you all for tuning in to yesterday’s webcast, “Simplify Your GWAS & Genomic Prediction with SVS”. I hope you all enjoyed it as much as I did! If you didn’t get a chance to join us for this live webcast, you can watch the recording below. We covered a lot of topics in so little time, but you all came up with a lot of excellent questions. So we thought it would be beneficial to share with you the answers to the top questions asked during the webcast.
Can you use GxE phenotype data for GWAS?
Yes, you can. In our Mixed Model Analysis menu (Genotypeà Mixed Linear Model Analysis). The SNPs, environment factors, and interaction terms are treated as fixed effects and the kinship or relationship between samples is treated as a random effect. The interaction terms are multiplied against the SNP being included in the mixed linear model and include this as a fixed effect in the MLM.
How do you output the dataset after filtered by QC?
To subset based on call rate- After you select Activate by Threshold, and set your desired threshold value, you can create a row subset spreadsheet. To do this, go to Select > Row > Row Subset Spreadsheet. Then you can rename this spreadsheet as “Sample with Call Rate >= 0.95” for example. Then you can merge this sheet with the genotypes spreadsheet by clicking on the merge icon within your call rate subset sheet and selecting the genotypes spreadsheet (Figure below).

From your filtered spreadsheet by call rate, you can perform LD Pruning. After LD Pruning is complete, you can do a similar process but instead you will choose Select > Column > Column Subset Spreadsheet.
Finally, if you did want to remove the sample pairs that are cryptically related to one another, when you run the IBD estimate, under Additional Outputs check this box and enter in zero.
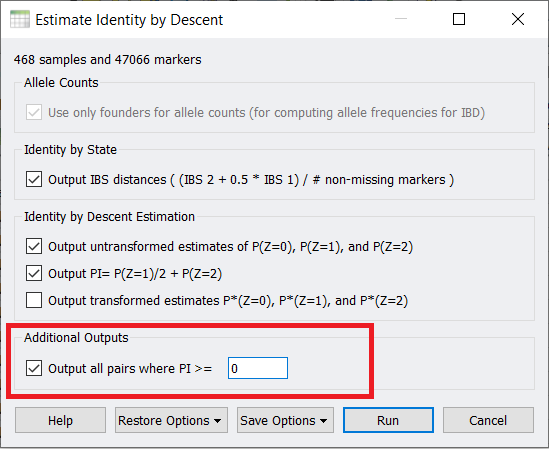
Then click on the Pairwise IBS Estimates (PI >=0) sheet and then if you right-click on the Estimated PI column (Column 7) and sort descending, you can see the sample pairs that are highly related listed at the top. At this point, you can manually exclude either one or both samples from your dataset.
You mentioned the use of IBD to find relatives and contaminated samples, can you explain how this is done?
In this case, if you were looking for duplicated samples, if you go through the steps above and look at the pairwise estimates between your samples, you would sort by descending and see a value of 1 if you had a duplicated sample. Sample contamination can be seen through the pairwise estimate as well if there is some unexpected sample paring perhaps between unrelated breeds. In your genomic relationship matrix/heat map you can also look for unusual patterns of relatedness, such as samples that appear to be related to many other samples as this may be an indication of mixing DNA samples.
We work with plant populations that often contain duplicated genotypes associated with different names. Is it essential to remove them before GWAS?
No, it is not. Because you expect this duplication, it is not necessary that you remove them for the association test. It is like the scenario that if you are working with twin studies, you would not want to delete duplicate samples.
When you used PCA to correct for population structure, does it automatically use all 10 PC or does it use just a few that you set somehow? How does this compare to using EMMAX?
Yes, I should have mentioned this. Automatically when you select the Principal Component sheet, all principal components that were run (10 PCs) would be corrected for in the association test. If I only wanted to correct for the top 3, in the Principal Component Analysis spreadsheet, I would need to deactivate the columns for the PCs that I do not want to include. I can then subset this spreadsheet and rename the sheet “Reduced Principal Components”. In the PCA Parameters tab of the association test, I would pick the reduced PCA spreadsheet instead of the full analysis spreadsheet.
EMMAX I think is relatively comparable to the results from PCA and IBD estimation. In SVS, EMMAX can be used in mixed linear model analysis if you would prefer to go this route. This can be accessed through the Genotype menuà Mixed Linear Model Analysis.
What’s the LD threshold you suggest during pruning?
Below are the recommended default options for LD Pruning.

The LD threshold option is the determining factor in whether there will be pruning between your marker pairs. However, the lower the LD threshold you use more markers will be pruned. Check out the blog post below that my colleague wrote on LD Pruning that you may find helpful.
Is LD pruning recommended when doing genomic prediction? What about Principal Components adjustments?
High levels of Linkage disequilibrium in SNPs can affect the performance and efficiency of genomic prediction models and is considered common practice. PCA is also recommended for similar reasons. I think that these recommendations generally stem from the fact that performing genomic prediction on many markers is challenging to work with because of multicollinearity and dimensionality. Not to mention a time-consuming process if performed on more markers.
If the significant SNP is located in intergenic sequence how to indicate the candidate gene involved in the phenotype?
Generally, with GWAS we are not looking at variants that directly impact genes. When a SNPs is associated with a trait, you hunt for the nearby genes with the mentality of when you have this SNP with these alleles you get a copy of this gene that is different. Since inheritance of the genome happens in large chunks (as long as the SNP is with about 10KB or so of gene) it’s likely that is correlates with different “version” of that gene. SVS does have the ability to annotate “nearest gene” up to 10KB away.
Is the genomic prediction in the base SVS or does it cost extra?
Yes, genomic prediction is included in the core SVS license.
What are the key factors affecting the reliability of genomic prediction of the phenotype?
First and foremost I would say selection of the method used for prediction affects the reliability of the prediction. However there are a number of components that can affect prediction reliability such as marker density (i.e Bayesian methods tend to perform better with high QTL), heritability, minor allele frequency, and if genetic architecture was evaluated (i.e relatedness, SNPs in LD, and population stratification).
Where does Bayes C fall in comparison to the other 2 prediction models?
Bayes C is like Bayes C-Pi however the Pi parameter is set to a high value (90%) instead of being calculated per loci. Having the Pi Parameter set at a high value stems from the assumption that most gene loci will have no effect for a given phenotype. Bayes C-Pi improved on this method by estimating the values for Pi via Gibbs sampling, overall improving the accuracy for prediction.