VarSeq serves as a streamlined approach to handle the rare variant analysis typically carried out for your next-generation sequencing data. Our team at Golden Helix seeks to simplify this process by automating the curation of staple databases needed for filtering and evaluation of clinically relevant variants. The goal we seek to accomplish with our software is to provide ease in standardizing your filtering process and variant evaluation through use of workflow templates designed by you and used routinely across a limitless number of patients. The increasing genomic data breeds creativity with filtering strategies and many users have a strong interest in implementing in-silico prediction tools such as CADD, REVEL, or SIFT and PolyPhen. These tools provide powerful insights into variant impact and are even a crucial component of standardized germline and somatic variant evaluation guidelines. The reality is, these tools only serve as a specific layer of evidence amidst the entire evaluation process and users must be cautious of utilizing these functional prediction scores directly as filters. The purpose of this blog was to assess the robustness of CADD as a direct filter in to isolate rare pathogenic variants.
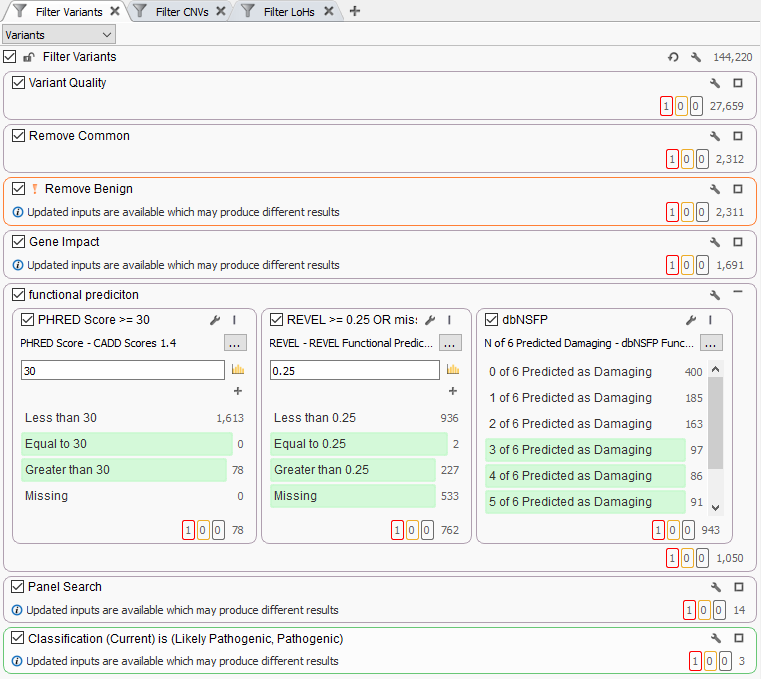
In some cases, users may add multiple functional predictions directly to their variant filters in VarSeq. You can see an example of this in Figure 1 where this workflow has a dedicated filter container comprised of CADD and REVEL scores as well as dbNSFP prediction votes across multiple predication algorithms. Question is, is this filter being too aggressive in eliminating what would otherwise be potentially pathogenic variants?
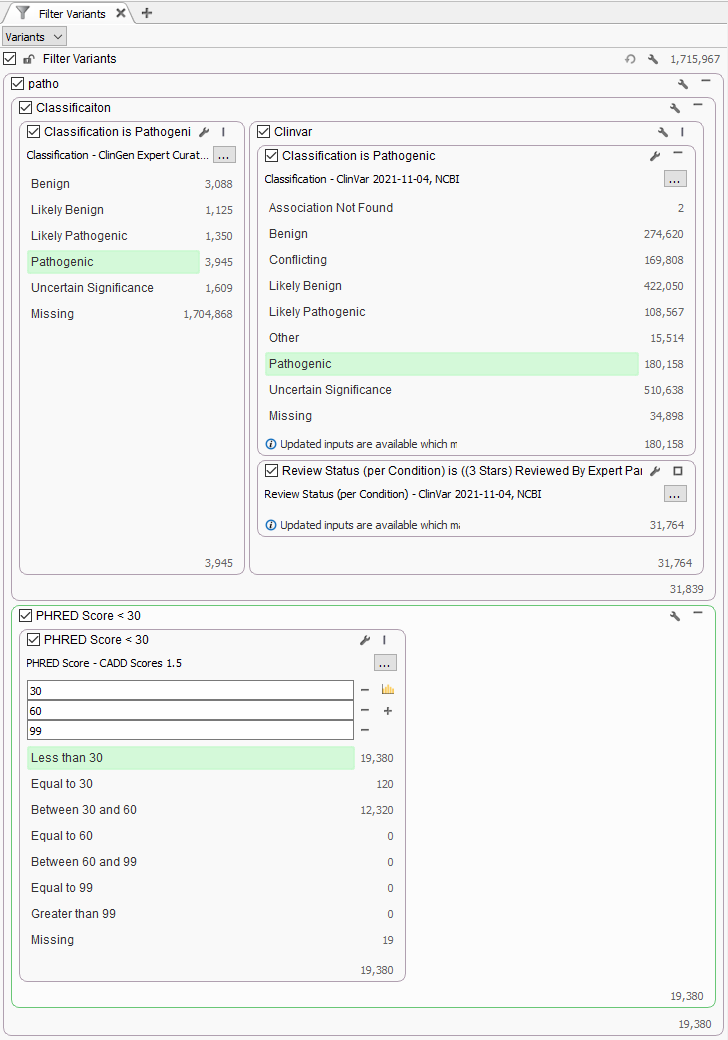
To answer this question, a test project was made with the recent 1.7 million variants in ClinVar imported into a VarSeq project. The filter was created to isolate well established pathogenic variants with high review status (3 or 4 stars) and known pathogenic in ClinGen Expert Curated Variants (Figure 2). Additionally, the CADD PHRED Score was used to categorize variants into three groups, pathogenic variants with lower PHRED score <30, between 30 and 60, and greater than 60. The PHRED-scaled scores range from 1-99 based on the rank of each variant relative to all possible 8.6 billion substitutions in the human reference genome. Nucleotide variants at the 10th% of CADD scores have a PHRED Score of 10, top 1% with PHRED Score of 20, and top 0.1% with PHRED Scores of 30. You can see that filter results show that out of the 31K strong pathogenic variants, over 60% (19,380) of variants have a PHRED Score less than 30.
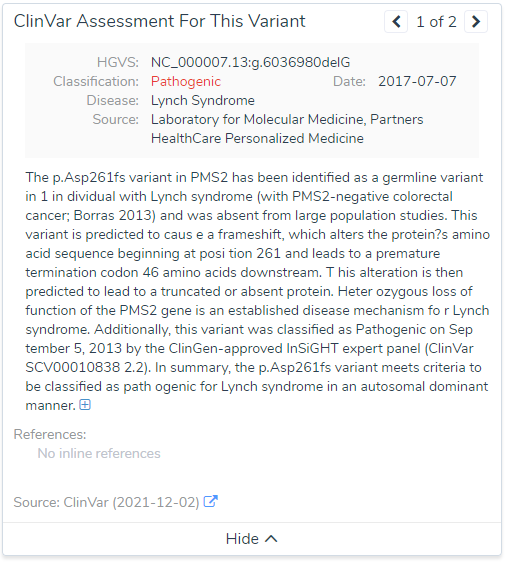
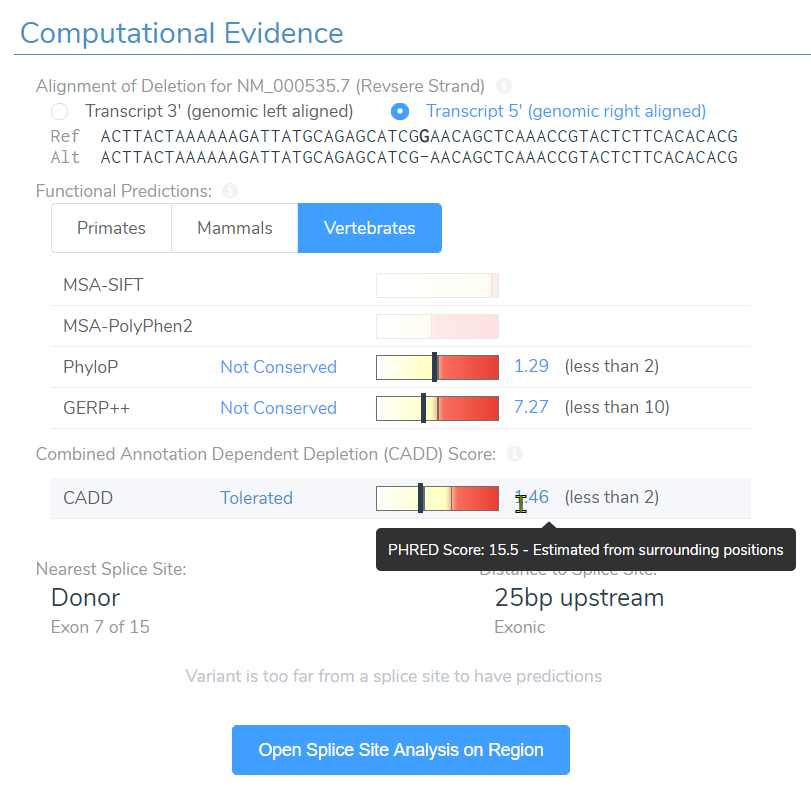
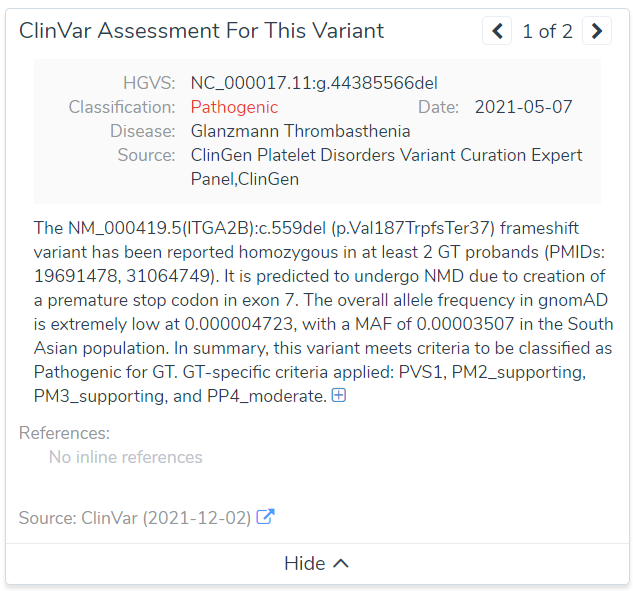
To dig a bit deeper, a few variants were selected for more investigation. One example variant was the G deletion at position Chr7:5997349 in PMS2. This is a well known pathogenic frameshift variant in exon 7 of 15 with over 200 other pathogenic loss-of-function variants downstream in the gene. You can see summary details of this variants VSClinical evaluation directly from the VarSeq software in Figure 3. Additionally, Figure 4 lists the details of this variant submission in not only ClinVar but also the ClinGen-approved InSiGHT expert panel. So, what impact do this in-silico predictions have on this variant?
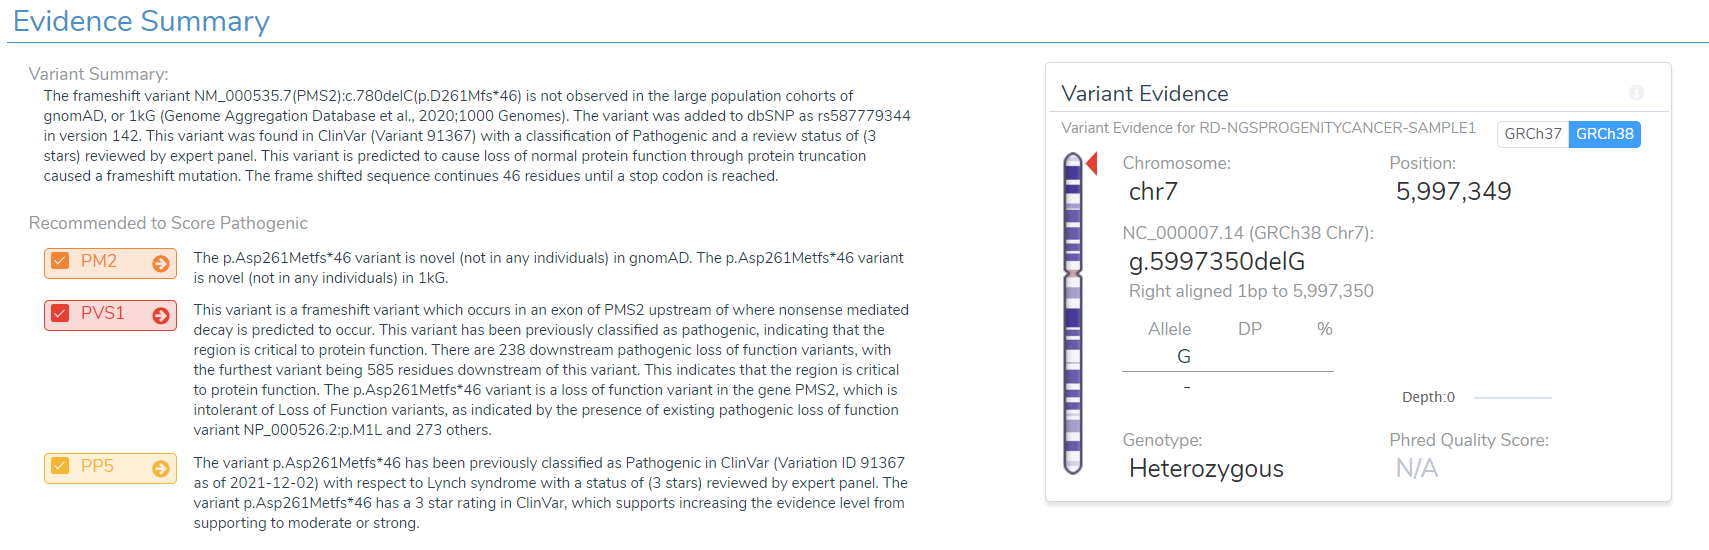
Well the truth is, SIFT and PolyPhen2 do not have scores simply because they assess impact of missense variants and not frameshift variants. However, near the bottom you can see the CADD score at 15.5 and assessment of “Tolerated”. Taking this assessment back to the filtering philosophy, we can see how easily a single filter can eliminate key variants we seek to find.
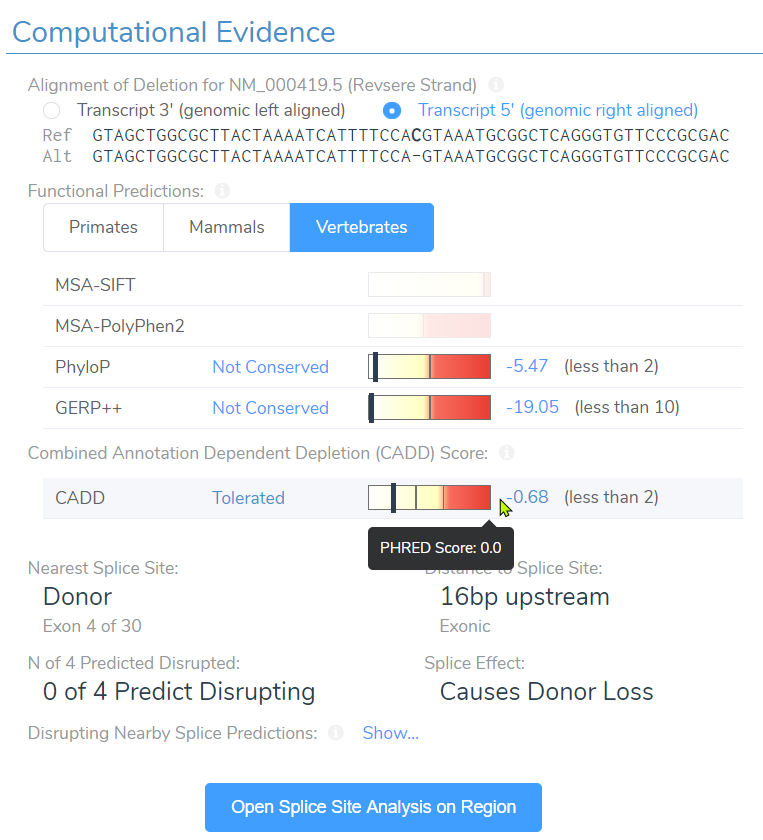
An even more severe example is of a known pathogenic variant in ITGA2B associated with Glanzmann Thrombasthenia (Figure 6). You can see the PHRED Score in this case is actually 0!
The strongest recommendation in this case is to rely on the in-silico predictions to impact the overall pathogenicity via the ACMG classifier itself, but perhaps resist the urge to utilize it in the filter directly. Another consideration show in Figure 8 would be remove the functional predictions from the filter (left), and instead group these fields for display in the variant table. The table can then be quickly reviewed or even sorted based on prediction scores. Please keep in mind the purpose of this blog is not to undermine the value of CADD by any means. This is more of an informative blog meant to showcase considerations the user can have when setting their standardized filters. Filters are a bit tricky and there is an almost infinite number of possibilities to make your filters too aggressive or to sensitive. If you would like to have a conversation with our support team on this subject or more, please reach out to support@goldenhelix.com

If you are interested in a trial of VarSeq please click here, or if you are interested in learning more about VarSeq and other products, please email us at info@goldenhelix.com. For questions in regard to using CADD in your NGS workflow, please email support@goldenhelix.com.