The overall objective of Trio Analysis is to leverage inheritance data to determine the ancestry of variants in the proband, whether that be through transmission from the mother and father, or of de novo origin. We have previously covered family based analysis in this blog post and this webcast, but both of these sources have been based on variants brought in from a VCF. Here, I will tell you about a powerful algorithm that will expand your trio analysis into the area of copy number variants (CNVs).
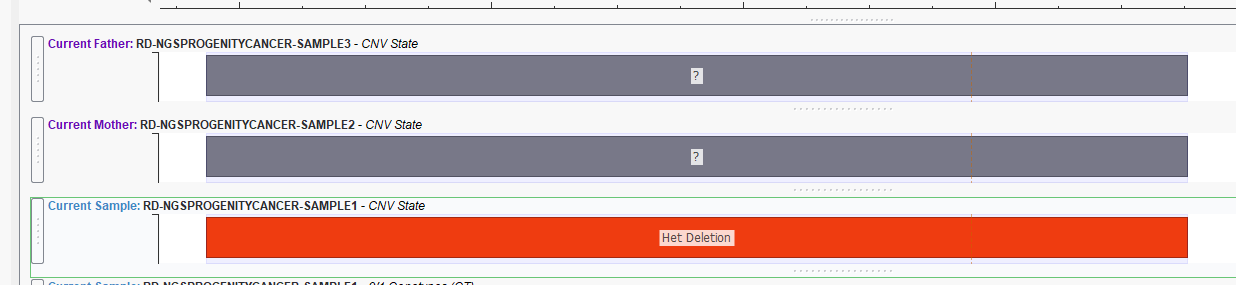
While plotting the CNV states for your family analysis can be informative (Figure 1), it does not give you information about the exact copy number or probability of inheritance.
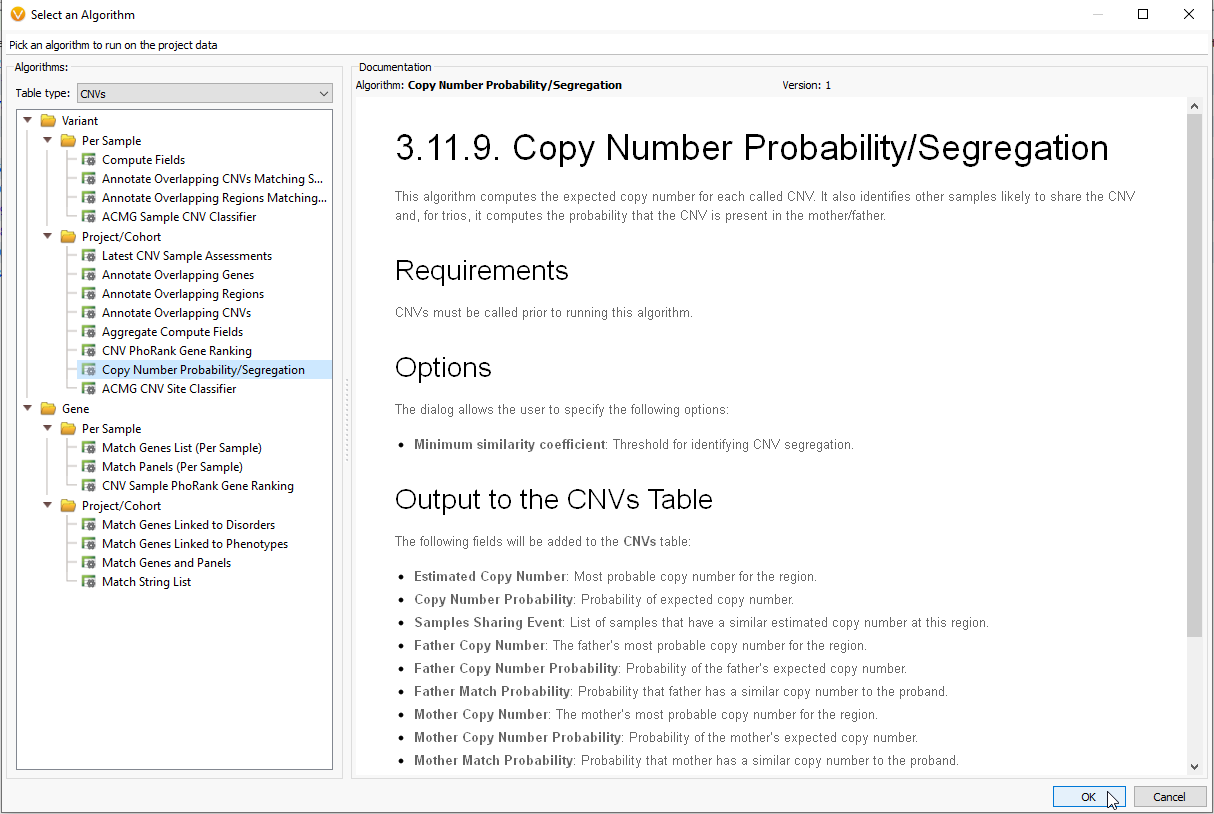
We have brought more power to our inheritance models with our Copy Number Probability and Segregation algorithm. The Copy Number Probability and Segregation algorithm (Figure 2) can be found under the Computed Data option when the table type is set to CNV. This particular algorithm uses not the CNV table to determine inheritance from mom and dad, but the coverage regions, which are calculated in VarSeq before the CNVs are called.
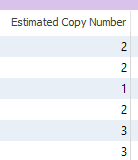
One output field for this algorithm includes the expected copy number (Figure 3). In a typical diploid human, our expected copy number for any given gene will be two. In the event of a CNV, a homozygous deletion will be displayed as a zero, a heterozygous deletion will show one copy, and in the event of duplications, there will be three or more copies of genes.
Another invaluable output of this algorithm is the probability prediction that the CNV was inherited from the mother or the father (Figure 4). In the example below, our Proband is Sample 1, the Mother is Sample 2, and the Father is Sample 3. Here we see that for this CNV, the copy number in the Proband is one, indicative of a het deletion. This copy number state is shared by Sample 2, the Mother. This information is invaluable for determining CNV links between affected and non-affected individuals in the population.

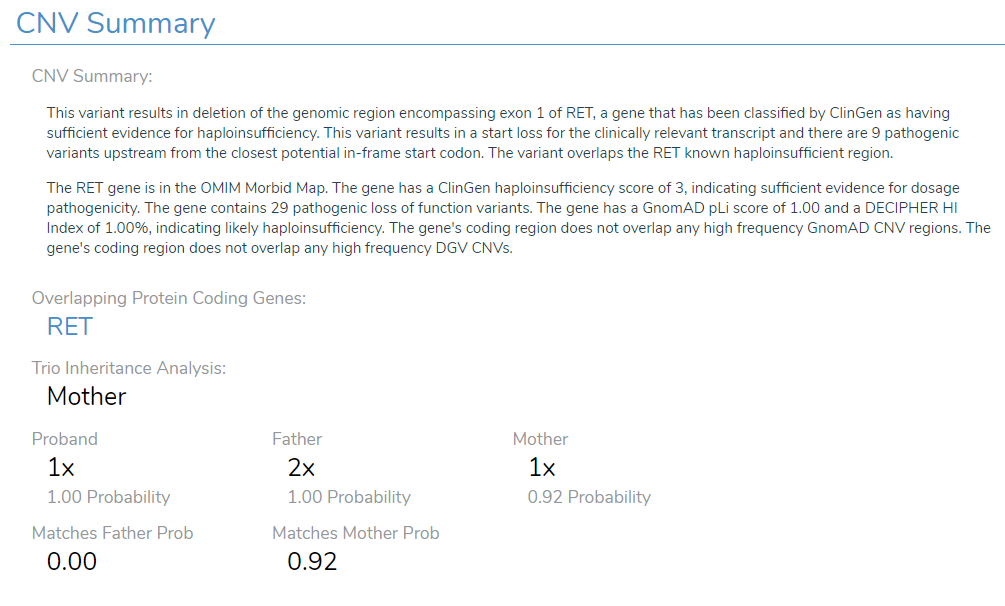
After utilizing the ACMG Sample CNV Classifier, a number of the CNVs in this particular example were shown to be Likely Pathogenic, and therefore I want to bring them into VSClinical for further evaluation. A major value point in VSClinical is that it takes you through the analysis of CNVs as a series of scoring questions that incorporate the inheritance data (Figure 5). Below we see a holistic overview of what different annotation sources have to say about this CNV, including input from OMIM, ClinGen, GnomAD, and more. Below that, the genes affected by this CNV are listed, followed by the inheritance information. We can see that the Proband has one copy of the gene at a probability of 1 on a score from 0 to 1. The Father has two copies at a probability of 1, and the mother has one copy at a probability of 0.92. Therefore, VSClinical presents us with the high likelihood that this CNV has been inherited from the Mother. This information will be valuable when moving through the scoring question phase of the evaluation.
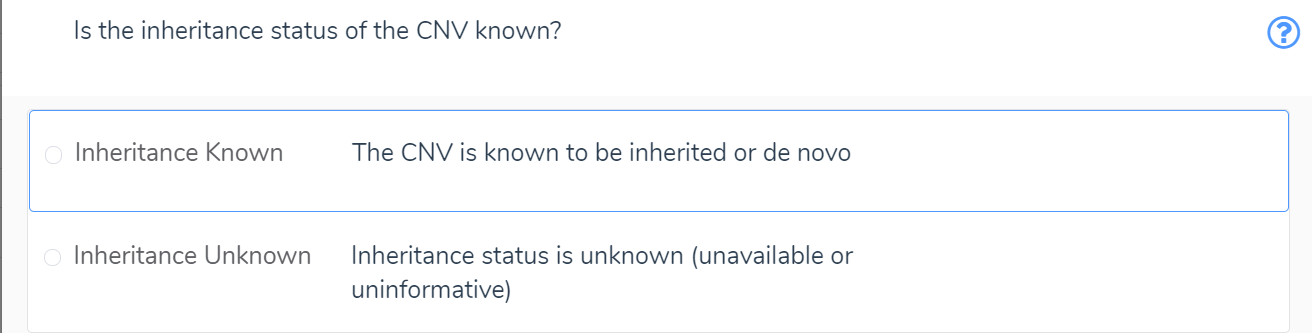
The last section of the CNV scoring questions, Section 5, is concerned with the inheritance of that CNV (Figure 6). It first asks if the inheritance status of the CNV known. We know that this CNV was inherited from the Mother, so we can click ‘Known.’
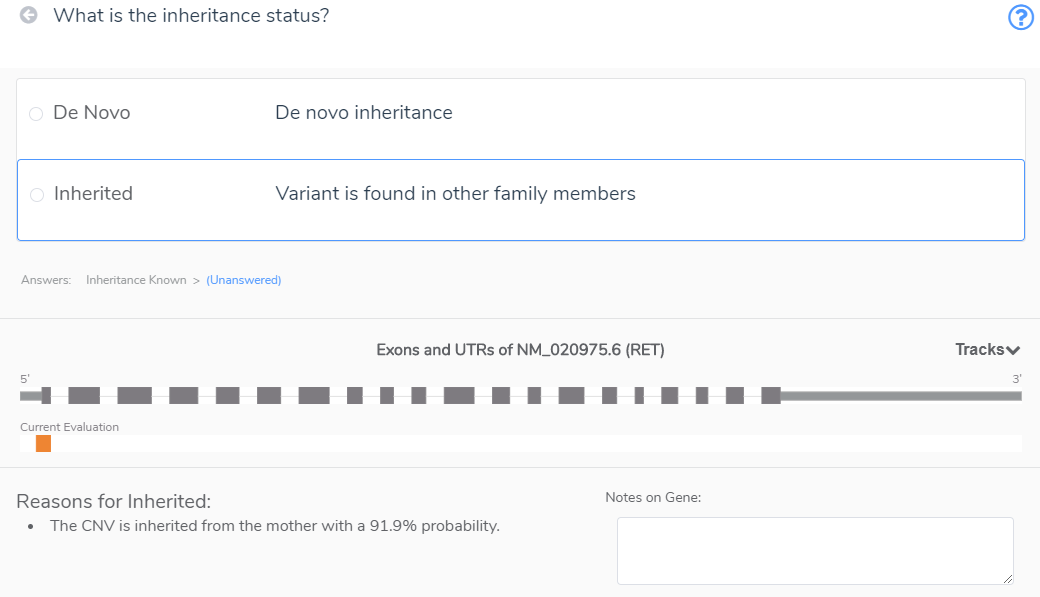
Next, we are asked for the inheritance status (Figure 7). VSClinical reminds us that this CNV was inherited from the mother, so we can score it as such.
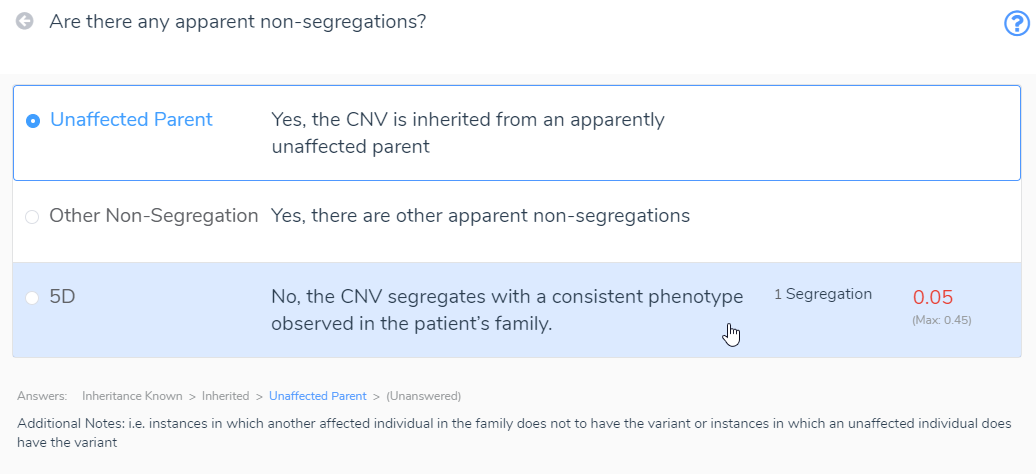
This particular CNV was segregated with a phenotype consistent with the Mother, so we score it 5D (Figure 8).
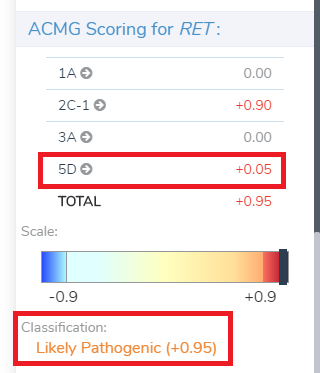
This +0.05 score is added to the already scored +0.90 (not shown), leading to a final score of +0.95, Likely Pathogenic (Figure 10).
By utilizing the Copy Number Probability and Segregation algorithm, we are able to leverage this inheritance information and contribute to our final Pathogenicity score. The automated ACMG recommendations made scoring this and other CNVs for the patient a straightforward and efficient process. If you would like to know more about CNV analysis in family workflows, please see our webcast on this subject here, or contact us with any questions at support@goldenhelix.com and we will be happy to discuss how our CNV + ACMG VSClinical solution can aid your workflow.