During the webcast yesterday, I demonstrated a few ways of customizing de Novo Candidate and Compound Heterozygous Candidate workflows to consider family structure that was slightly different from the default trio workflow. The families included additional affected and unaffected siblings added to a trio as well as looking at what could be done if there were only two affected siblings… Read more »
Wednesday, May 11th 12:00 pm EDT VarSeq contains default workflows for Trio analysis which include filter chains for identifying de Novo and Compound Heterozygous variants, but what if you have data for a full Quad or even just a few siblings? How could your VarSeq workflow be adjusted to handle this custom family structure?In this presentation we will demonstrate how… Read more »
Clinical reports come in all shapes, sizes and flavors. With that in mind, our clinical reporting interface VSReports was built to be highly customizable and flexible. With a little Javascript and HTML know-how, your clinical reports can be customized to meet the needs and goals of your lab. With a little Javascript and HTML know how, you can customize yours as… Read more »
Did you know you can analyze your Genotyping by Sequencing (GBS) data in SVS? Well you can! You can combine tools for both GWAS quality control and analysis with tools for NGS data analysis to either identify SNPs in your dataset or to identify differences between populations or sub-species. If your species has a reference sequence or even if you… Read more »
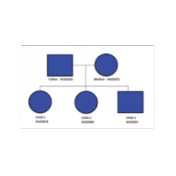
Compound Heterozygous Workflows: Including a 2nd Affected Child Looking for Compound Heterozygous regions for a trio is fairly straight forward in VarSeq, we include this workflow in our shipped Exome Trio Template. An example of which is included with our Example Projects which can be found by going to File > Example Projects > Example YRI Exome Trio Analysis. But… Read more »
With the release of our updated GWAS E-book, we have recently updated the GWAS example project (SNP Genome-Wide Association Tutorial – Complete). This updated project includes more details about how spreadsheets were generated, how to generate plots and which images were used for the GWAS E-book. This information can be found in the User Notes view in the project navigator and… Read more »
I hope your 2016 is off to a good start! We at Golden Helix have been busy preparing and planning new and updated content for the community. First up is an updated GWAS ebook which includes a sample Meta-analysis example project. In the 2nd edition, we start with an introduction to GWAS exploring its biology and origins as well as… Read more »
The most common use of the VarSeq Match Gene List algorithm of course is to determine if the variants in your data set are contained within your genes of interest. As an example of this, say you are working with a whole exome trio and only want to consider those variants that are contained within the 56 genes recommended by… Read more »
As VarSeq’s adoption has grown among analysts using whole exome data to diagnose rare diseases, a couple of family designs outside of the common trio of an affected child and both parents have come up frequently. While having both parents provides the maximum power to discover de novo mutations and recessively inherited variants, it is not always possible to contact… Read more »
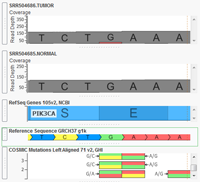
With the release of VarSeq 1.3.1 we have included a new demo project to showcase a single tumor-normal pair analysis workflow. The project can be accessed through VarSeq and VarSeq Viewer by going to File > Open Example Projects > Example Tumor-Normal Pair Analysis. This project contains an exome pair (Normal-N990005 and Tumor-T990005) from the Gastric Cancer study Exome sequencing of… Read more »
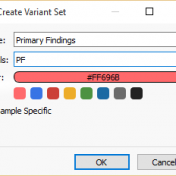
With the release of VSReports, we added the ability to “select” rows of your filtered output (often variants, but potentially things like coverage regions or genes) with a new feature dubbed “Record Sets”, but more often described as “colored checkboxes” for your tables. Although necessary for the important task of marking primary, secondary or other sets of variants for a… Read more »
Give our SVS viewer a try today! Interested in seeing what the SNP & Variation Suite (SVS) software can do? Download the free SVS Viewer! With the SVS Viewer, you can explore and interact with the workflows of a pre-built projects. To get you started, we have included a SNP GWAS project for you to download. And don’t worry, it is… Read more »
While VarSeq comes with a number of starter workflows that are stored as templates, customers also have the option of creating filter chains from scratch; analyzing a single exome may require you to do exactly that. In this blog, I’ll go through analyzing a single exome and generating a list of variants for further study. After importing the variant data… Read more »
We are pleased to announce that another one of the most asked for features is going to be a part of our SNP & Variation Suite™ software, Gene by Environment Interaction Regression (also known as GxE Regression). Earlier this year other highly asked for features were added to SVS including applying a prediction model to a new dataset, cross-validation for… Read more »
A prerequisite for clinical NGS interpretation is ensuring that the data being analyzed is of high enough quality to support the test results being returned to the physician. The keystone of this quality control process is coverage analysis. Coverage analysis has two distinct parts. Ensure that there is sufficient coverage to be confident in called variants Make certain that no… Read more »
VarSeq now supports analysis of paired Tumor/Normal samples! Tumor/Normal support has been one of the most common feature requests for VarSeq since it was launched late last year, and we are excited to make this functionality available to all of our VarSeq users in the latest update (version 1.1.4). VarSeq is a powerful platform for annotation and filtering of DNA… Read more »
One of the lesser known functions in SVS allows the user to create Venn diagrams comparing variants found in multiple spreadsheets. These different spreadsheets could come from individuals samples, a case vs. control group or several variant databases. It is a helpful tool for visually comparing different variants. Start by creating spreadsheets for each group/samples you’d like to compare. The… Read more »
There are many approaches that one might use to define a variant as potentially deleterious. For example, we often see analysis workflows based on rare, non-synonymous variants, perhaps incorporating additional annotation sources that capture known or predicted consequences of coding variants. Annotations for coding regions of the genome are relatively abundant and familiar to genome scientists. We are comfortable in… Read more »
Our VarSeq as a Clinical Platform webcast last week highlighted some recent updates in VarSeq that support gene panel screenings and rare variant diagnostics. The webcast generated some good questions, and I wanted to share them with you. If the questions below spark new questions or need clarification, feel free to get in touch with us at info@goldenhelix.com. Question: Should… Read more »
Over 650 GenomeBrowse licenses have been registered and downloaded since the beginning of 2015, and with so many people enjoying the utility of this freeware program, I wanted to showcase some advanced tips and tricks so you can get more out of GenomeBrowse! Under the Controls panel, when you’re clicked inside a data plot, there is a “Filter” tab. This… Read more »