True to its nature, VarSeq offers multiple data export options. You can export result tables from VarSeq to Text, VCF, a VarSeq annotation file and most importantly an XLSX (Excel) File.
VarSeq’s Excel export options provide a lot of flexibility in the information that is exported and preserve the formatting of data during the export process from VarSeq to Excel. This ensures that you export only the information you want or need and have full access to information in the exported Excel file as you would in VarSeq.
In the following example, we have performed a trio analysis on our data with 6 different inheritance patterns/workflows (De Novo Candidate, Compound Heterozygous, Recessive Homozygous, Dominant Heterozygous, X-Linked and Known Rare Pathogenic). We will explore how to use VarSeq’s Excel Export option to export the data we want from VarSeq to Excel.
Using the table lock down feature in VarSeq, we’re able to create 6 different table views that correspond to the results of the output from the 6 inheritance patterns.

Trio Analysis Workflow with 6 inheritance patterns and 6 table views, corresponding to the inheritance patterns.
To lock down a table, simply click on the padlock icon in the table view. Then you can open up another table view tab and select the results for the next workflow and lock down that table (repeat for each workflow).
Once we have a table view for each workflow/inheritance pattern, we can then export the output of the 6 workflows into one excel spreadsheet with 6 tabs (corresponding with the 6 workflows). Click the Export button and choose the XLXS option.
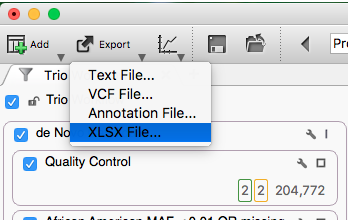
Exporting data from VarSeq to XLSX.
In the resulting dialog, we select the tables we want to export. In this case, we want to export all 6 tables (corresponding to the 6 inheritance patterns).
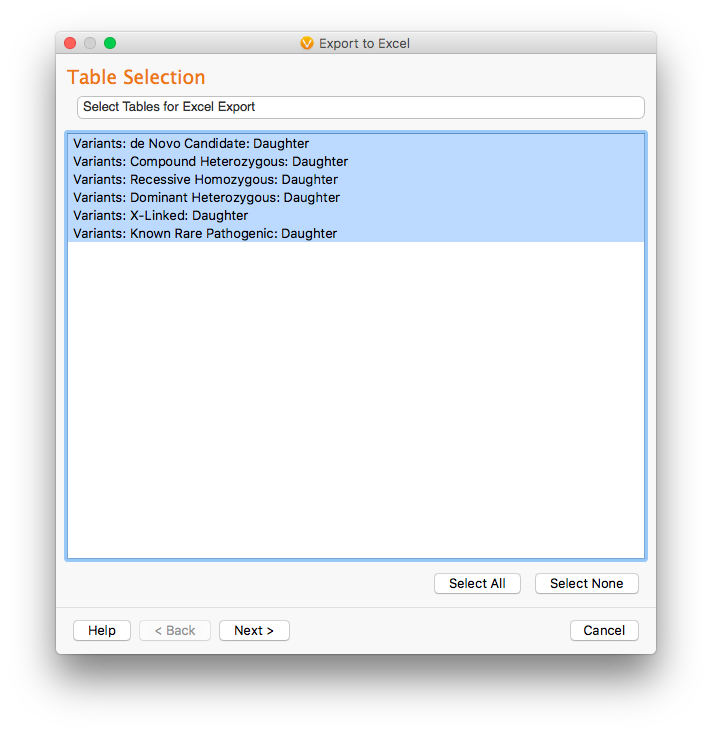
Excel Export table selection dialog.
Then, we select the fields to be exported. By default, the selected fields will correspond to the fields shown in the VarSeq table view. However, in the field selection dialog, we can select and unselect the fields we want to export. We can also change the ordering in which these fields and columns appear by using the up and down arrow buttons. Additionally, each of the tables can have different field selection preferences and organization by selecting the table to modify at the bottom of the Field Selection dialog.
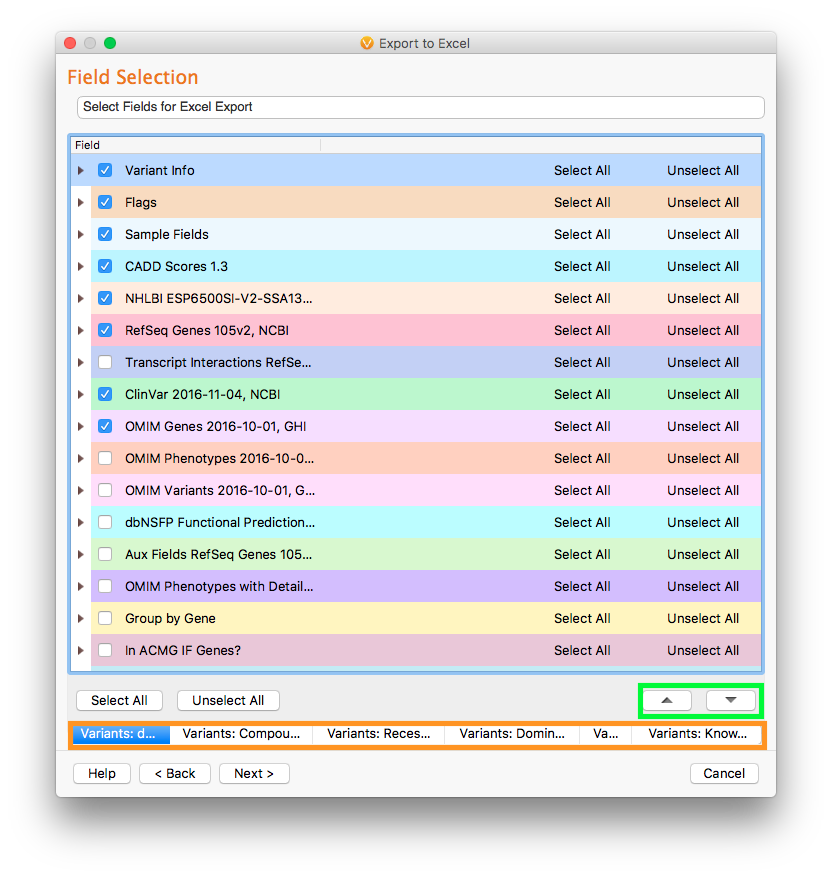
Excel Export field selection dialog.
The last dialog in the data export includes additional export options like the ability to change how missing values are represented in the Excel file. In VarSeq, missing values are represented as “?”. However, we may want to represent missing values differently in our exported Excel file. We also have the opportunity to include or exclude hyperlinks (this includes OMIM, PubMed ID, and NCBI link and references) in the exported results. By default, hyperlinks are included in the export.
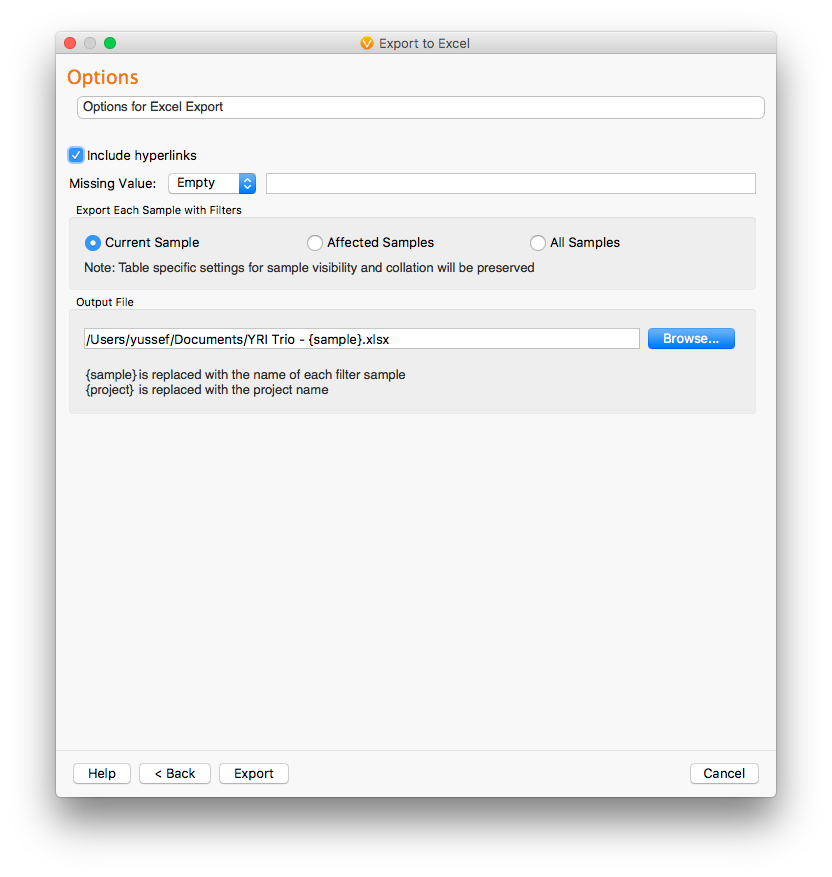
Excel Export options dialog.
Once the export is complete, we can choose the “Open location” button to open the location where the excel file is saved.
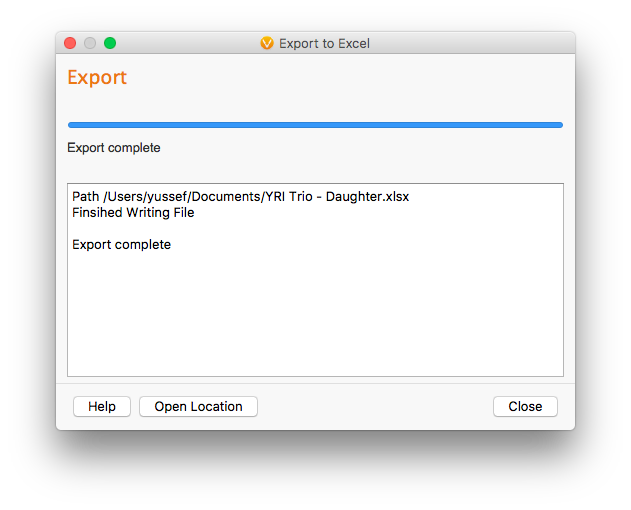
Excel Export export complete dialog.
The exported data in Excel looks like the following:
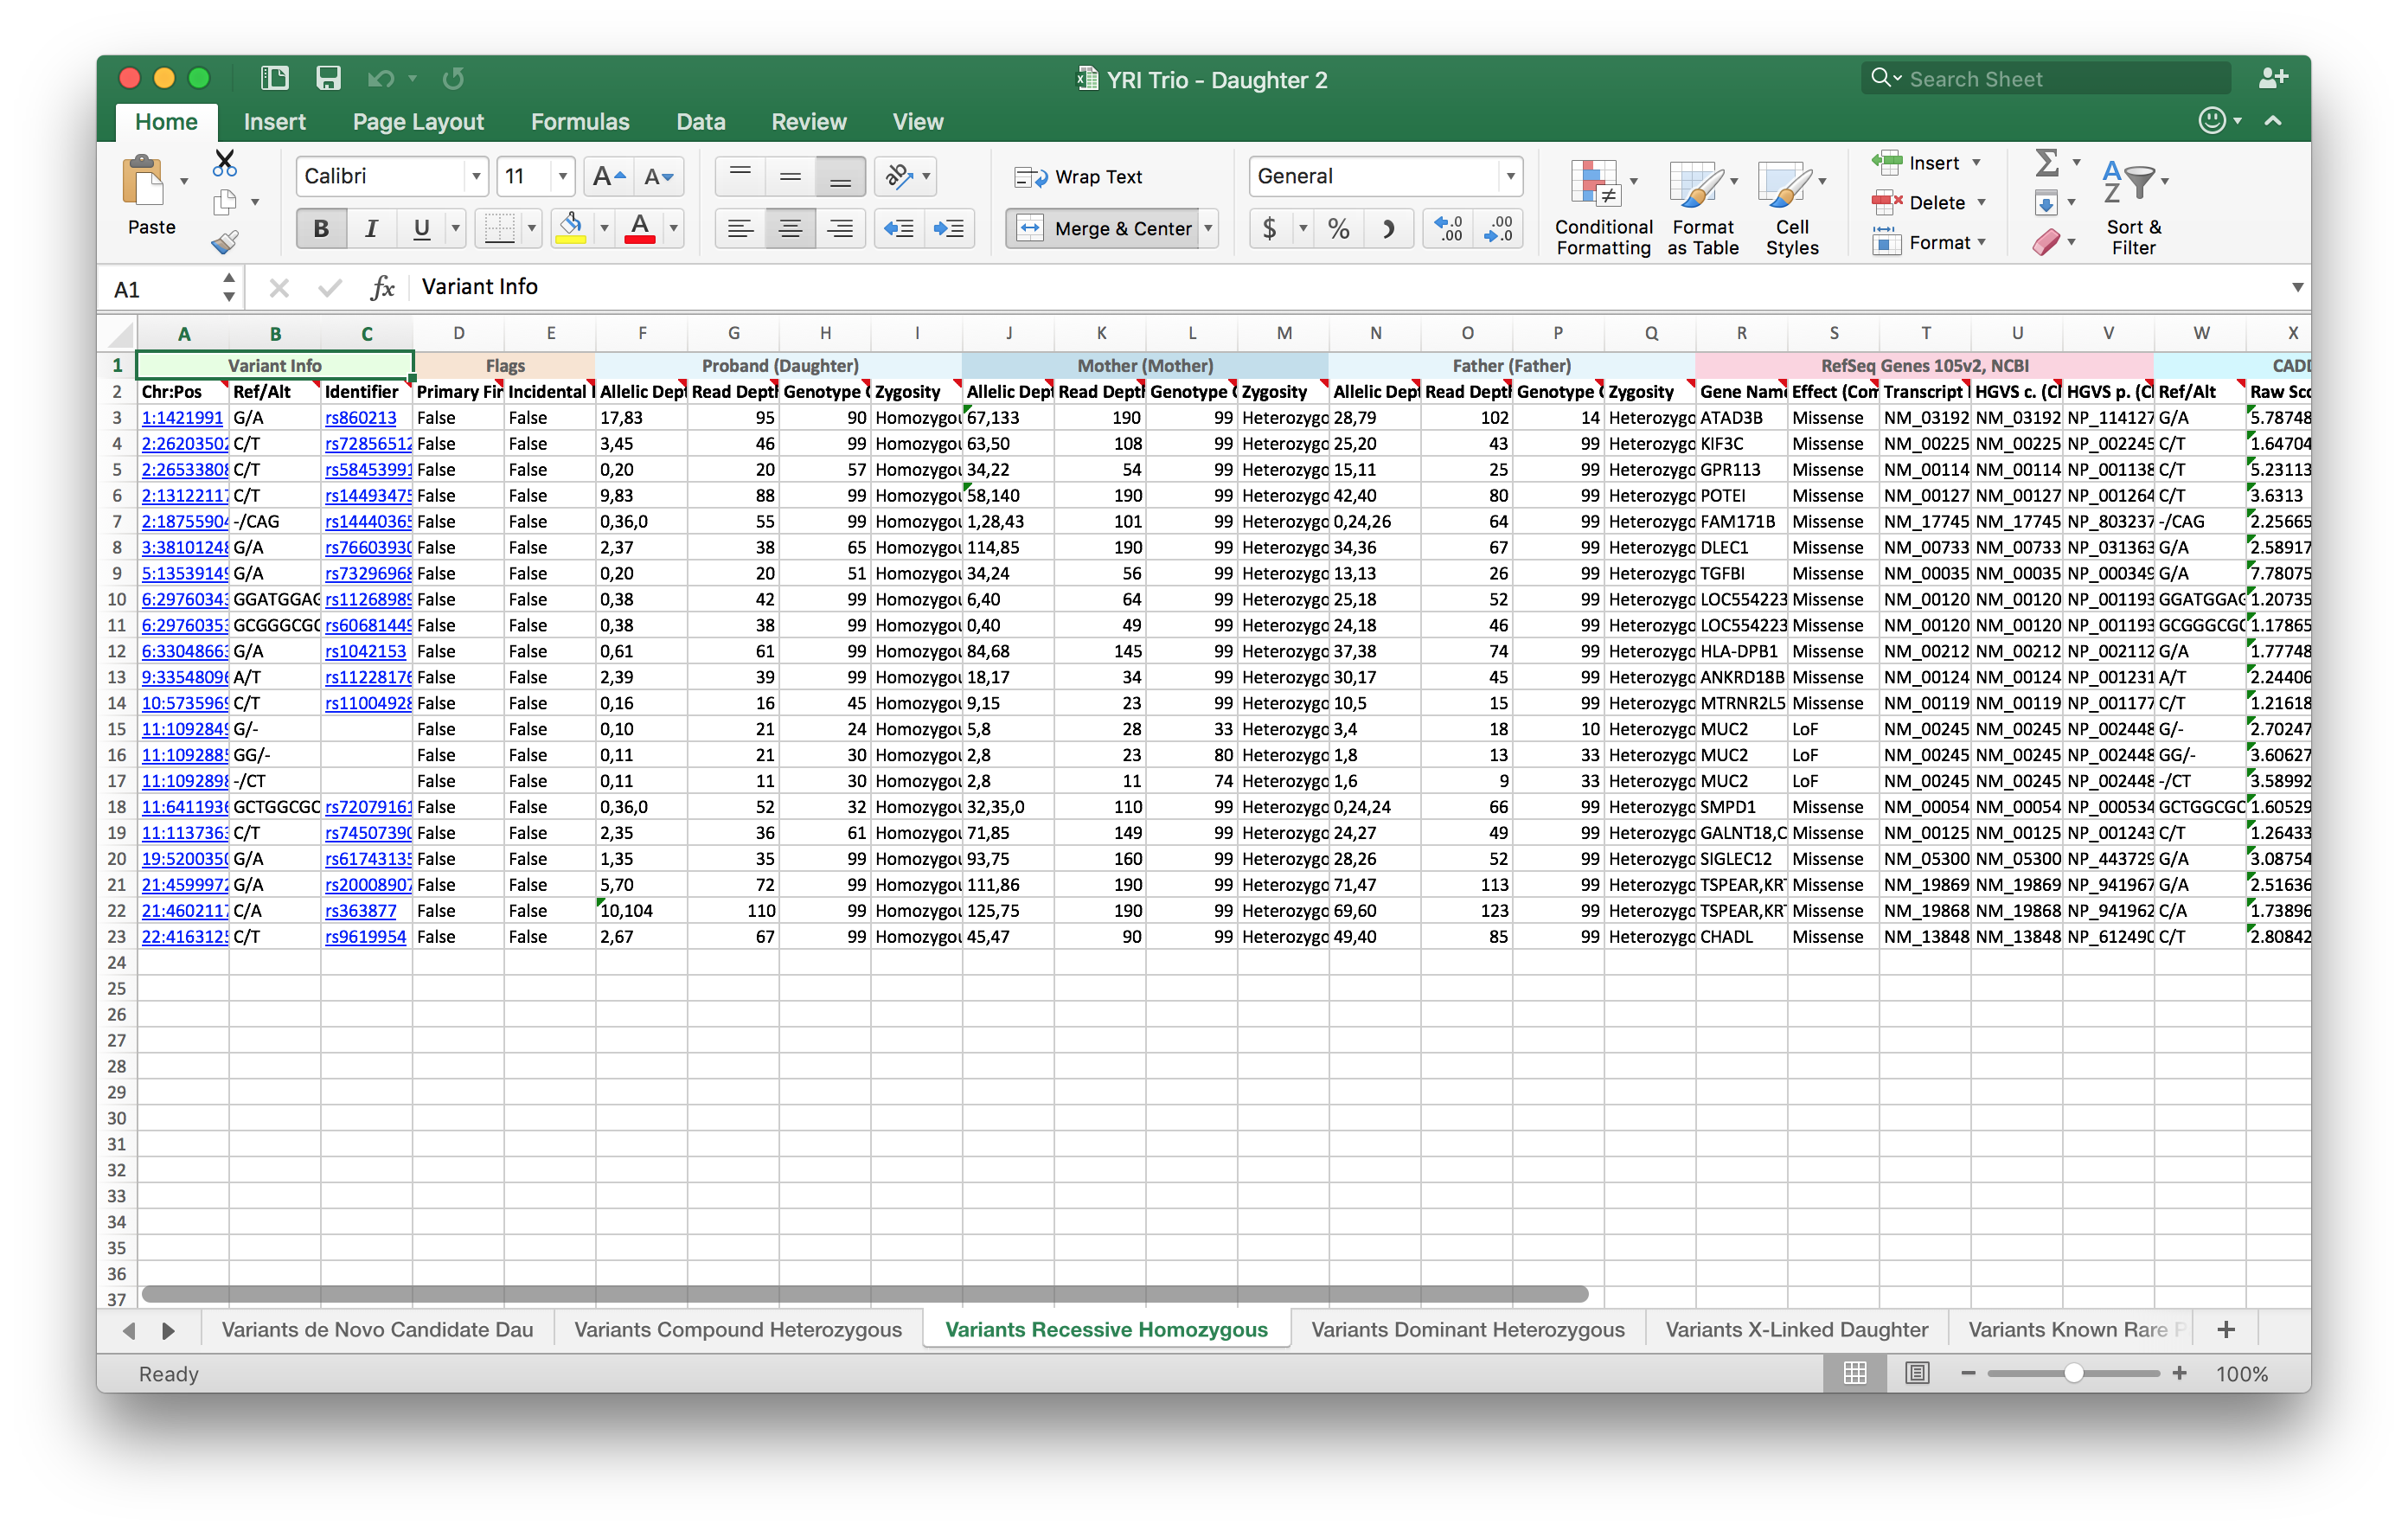
Resulting Excel spreadsheet with 6 tabs corresponding to the 6 inheritance patterns and workflows.
Things to note in the exported Excel File:
- 6 tabs at the bottom corresponding to the 6 inheritance patterns
- Hyperlinks are preserved from VarSeq to Excel
- The coloring on the headers are also preserved from VarSeq to Excel
- Exported annotation sources and columns are in the order specified during the export process
- Variants that have been flagged in variant sets are represented in the Flags sections as “True”/ ”False” values
Please let us know if you have any questions about saving your results in VarSeq to Excel, by contacting us at support@goldenhelix.com.