When studying complex diseases that may have multi-genic contributions from across the genome, it is not uncommon to see what may appear like elevated correlation between your trait or other test variable and the SNPs across the genome.
The problem is at first glance you won’t be able to tell if this is due to a population structure in your data that is aligned with your trait (on no!), or due to the polygenic nature of your trait raising the signal for all SNPs in LD (oh yes!).
Well, folks from the Schizophrenia Working Group of the Psychiatric Genomics Consortium published a paper in Nature Genetics with a technique to sort this out called LD Score regression, and by customer request we added their method to the upcoming version of SVS!
Heritability and Genetic Correlation Reports
With the upcoming release of SVS, there will be a number of new menu items that provide easy interfaces to the heritability estimate and genetic correlation features in the LDSC package that complement the LD Score paper project.
The basic process is to join in precomputed LD Scores for a representative population in with your GWAS statistics spreadsheet.
You can compute these yourself or use one of the ones provided by the BROAD institute based on the European or East Asian population groups from the 1000 Genomes population
Our LDSCORE Importer merges the multiple “ldscore” files into a single output spreadsheet.
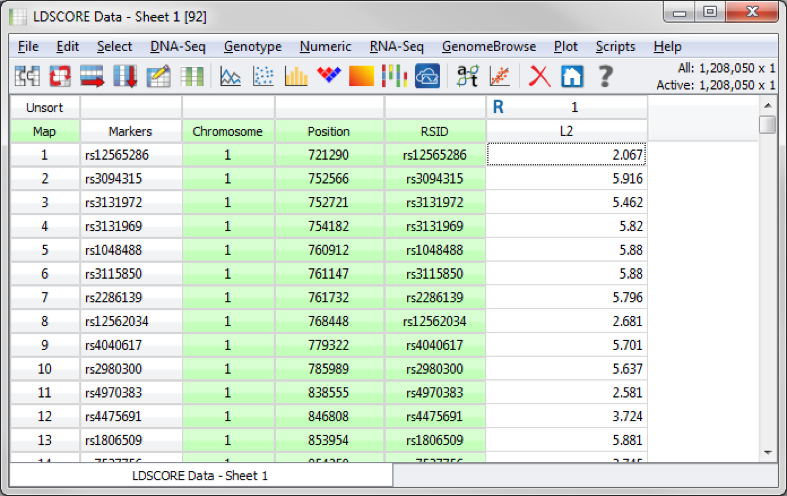
Imported LDScores ready to be joined to your GWAS results
We also provide the pre-processed LD scores ready to use as DSF files:
- East Asian LD Scores DSF File
- European LD Scores DSF file
The LD Scores spreadsheet should then be merged into a GWAS Association Test Results spreadsheet before running the new LD Score Regression script under the Genotype menu. It is suggested to perform quality assurance by filtering out low quality markers based on their imputation quality and/or minor allele frequency (MAF) prior to running this script.
There are two modes this script can run on, Compute Heritability estimate only and Compute Genetic Correlation with additional traits. The first option will compute just a heritability estimate and related statistics of one trait and the second will compute the heritability of two or more traits and the genetic correlation and covariance between them.
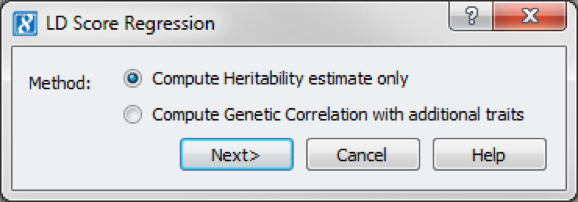
LD Score Regression Dialog
When computing a heritability estimate of a single trait, the dialog will ask for a set of fields from the merged spreadsheet to use by the algorithm.
And when the script is complete, a result viewer will be created with an estimated heritability of the trait in the spreadsheet the script was run from.
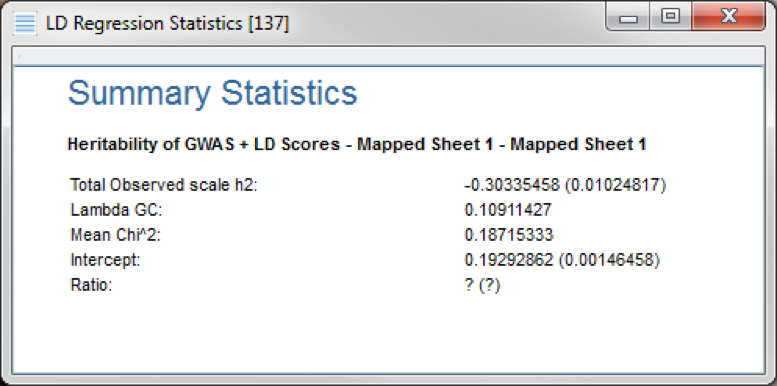
Summary Statistics Result Viewer
If the second option is selected, Compute Genetic Correlation with additional traits, spreadsheets with different traits can be selected and will be compared to the trait in the spreadsheet the script is run from.
The result viewer created will contain the computed heritability estimate for each trait and then a genetic covariance and genetic correlation score for the first trait (the spreadsheet the script was run from) and each trait that was included in the dialog above.
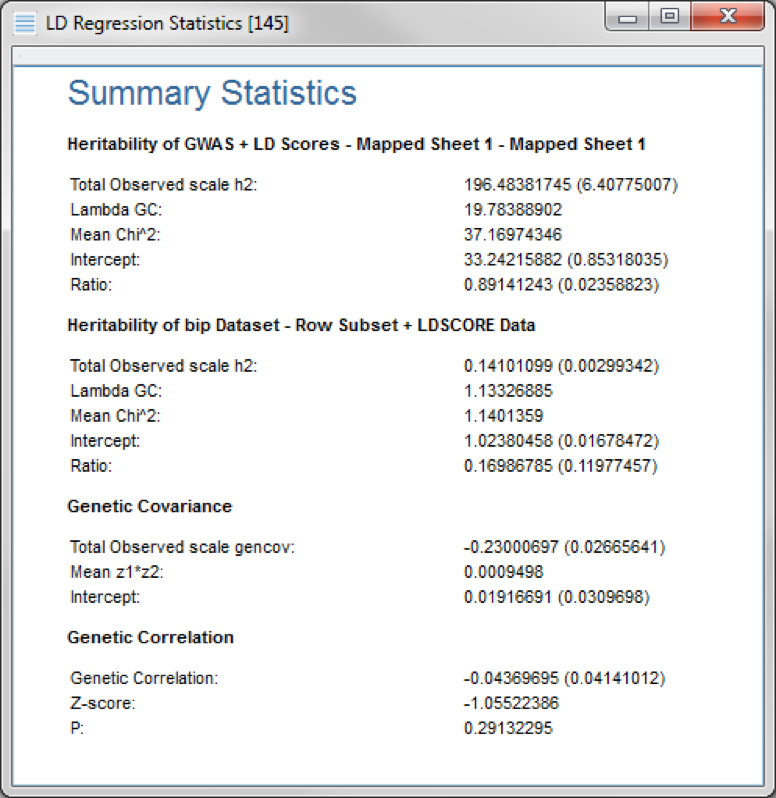
Result viewer of heritability and pairwise genetic covariance and correlation
The Complete GWAS Solution
We continue to build on the broad and deep suite of statistical association and analysis tools in SVS and think LD Score regression is a great example of incorporating suggestions from our active user base. Stay tuned as we announce more advanced methods coming to SVS and reach out to us with your own requests!