In our final chapter of this variant annotation blog series, we will discuss additional annotations that provide powerful variant filtering and analysis capability. Golden Helix curates many annotations in a way that allows for simple analysis and saves the users the hassle of all this data management. Whether you are trying to capture rare variants known across multiple subpopulations in frequency tracks, finding the potential effect of any variant with functional prediction databases, or merely getting in-depth gene level information, we cover it all. Let’s take a look in more detail at some commonly used tracks, starting with those focused on allele frequency.
Frequency Tracks
1kGenome
The 1kGenome project ended up creating one of the largest public catalogs of human variant and genotype data (>85 million variants). There are efforts to maintain and expand the project even more! The overall goal was to identify most of the genetic variants with frequencies of at least 1% in the populations studied. The final phases of the project collected data from 2,504 individuals and reports descriptions of variants and alternate allele frequencies for each population. You can see all the available fields from 1kGenome in VarSeq in Figure 1. In the 1kGenome track, you’ll find the alternate allele frequencies for various populations, ancestral alleles, and structural variant types/length.
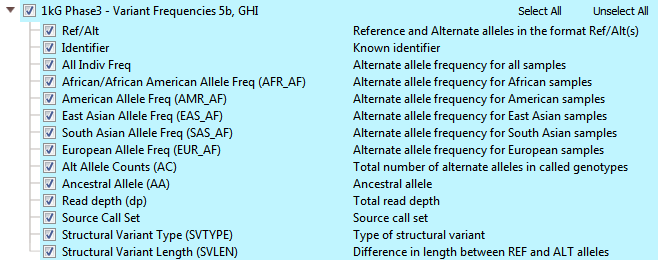
Fig 1: Complete list of 1kGenome annotation fields viewed in VarSeq.
NHLBI
NHLBI’s goal is to discover novel genes and mechanisms contributing to heart, lung, and blood disorders. By use of NGS sequencing of exons (contains >2 million variants), NHLBI has become a rich collection of phenotyped populations with its most current release consisting of data from 6503 samples. NHLBI provides alternate and minor allele frequencies for each variant (Figure 2). Regarding the minor allele frequency, if the reference allele is minor the frequency will be for the minor allele and not the alternate (non-reference) allele. In other words, it is a way to find which allele state is rarer in each population. The minor allele frequency (MAF) is a great field to use when filtering. For example, the filter “keep variants with a MAF < 0.01” keeps variants with an alternate allele frequency (AAF) < 0.01 as well as > 0.99. If your sample has a reference allele, and the reference is minor, it may be functional, and so this is the desired behavior.
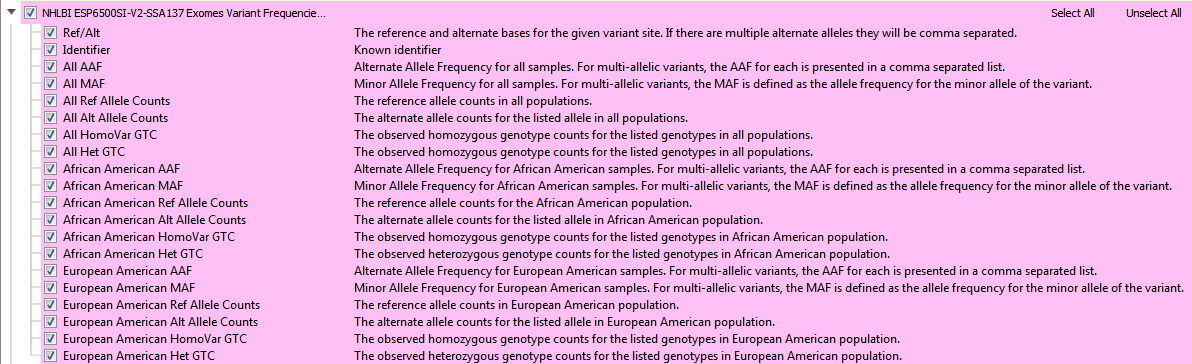
Fig 2: All NHLBI ESP fields viewed in VarSeq with minor (MAF) and alternate (AAF) allele frequencies.
ExAC & gnomAD
The Exome Aggregation Consortium (ExAC) is a collaborative effort to collect and homogenize the representation of exome sequencing data with over 10 million variants. Both the aforementioned 1kGenomes and NHLBI are just two of many contributing projects in the ExAC database. This dataset spans 60,706 unrelated individuals from various disease-specific and population genetic studies. One unique feature to ExAC is the reporting of multiple QC flags for low-quality variants. You can see the list of optional QC fields in Figure 3a. You may have also noticed how many more fields ExAC has than the two previous frequency tracks. In addition to having the new QC fields, ExAC’s substantial increase in cohort size also allowed for the increase of sub-populations with additional data of each group’s associated allele, chromosome, homo/hetero/hemizygous counts (Figure 3b).
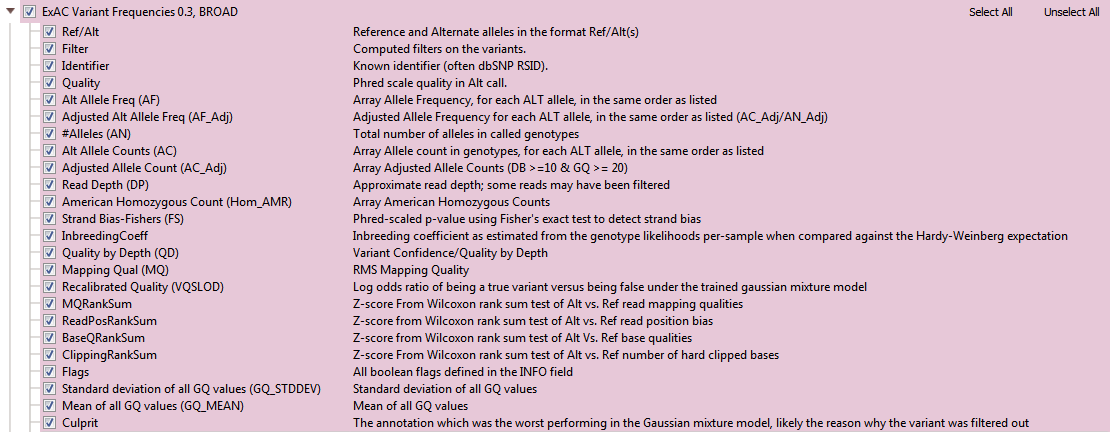
Fig 3a: ExAC Variant Frequencies: QC fields seen from VarSeq.
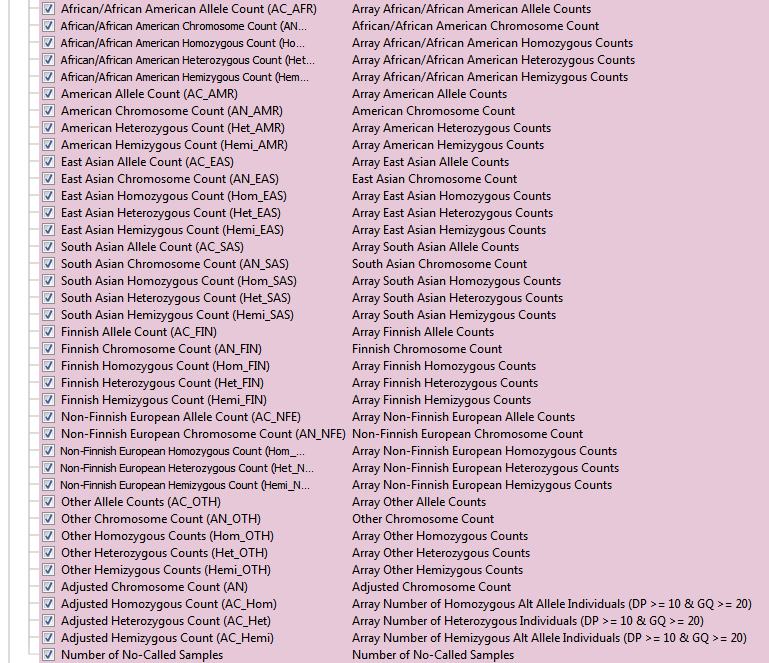
Fig 3b: ExAC Variant Frequencies: subpopulation frequency data and zygosity counts.
ExAC’s integration into VarSeq occurred quite some time ago with newer versions added over the years. However, one significant improvement to ExAC was so substantial, that it ended up becoming a new annotation.
GnomAD is an upgrade to ExAC and provides a dramatic improvement in the understanding of the landscape of variants in humans. As a branch off of ExAC, gnomAD has become a new independent product with expanded cohort size, updates to the data processing pipeline, and a novel approach to flag low-quality variants. GnomAD not only is comprised of 123,136 exomes (with >17 million variants, but also 15,496 genomes (>285 million variants) and the two are represented separately in your Golden Helix software (see Figures 4a and 4b). When curating data from gnomAD, we sought to simplify/improve the representations of each variant. The primary goal of our curated form of gnomAD is to give users a simple way to validate variants quality with these additional quality fields and to compile multi-allelic sites. Allele frequencies are a great early stage filter to narrow your search across variants, but what kind of impact do these rare variants have on protein function?
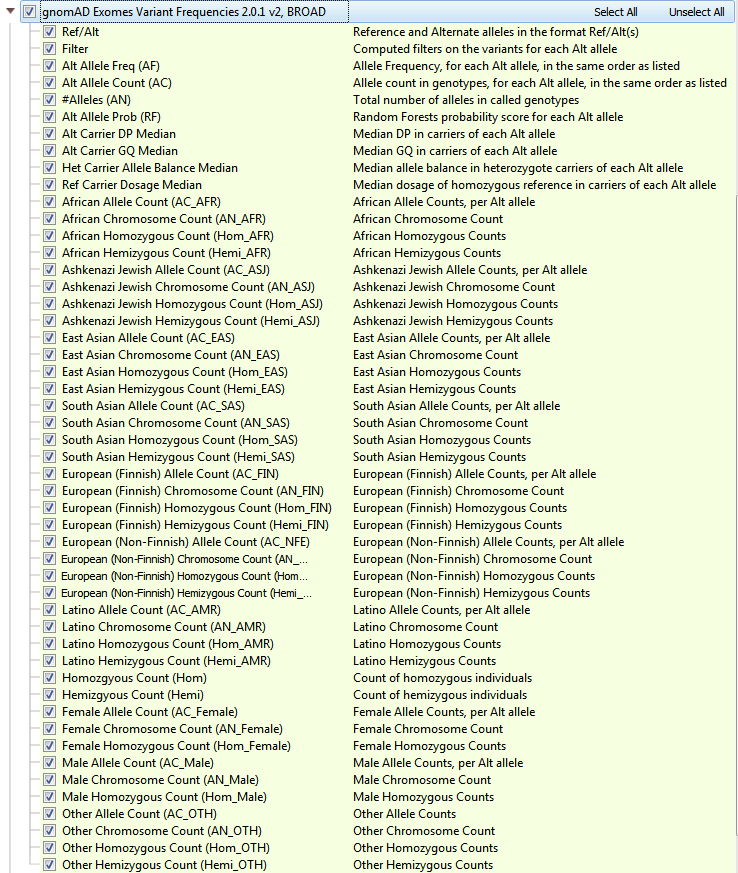
Fig 4a: gnomAD Exome Variant Frequencies. Including all subpopulation allele counts and quality fields
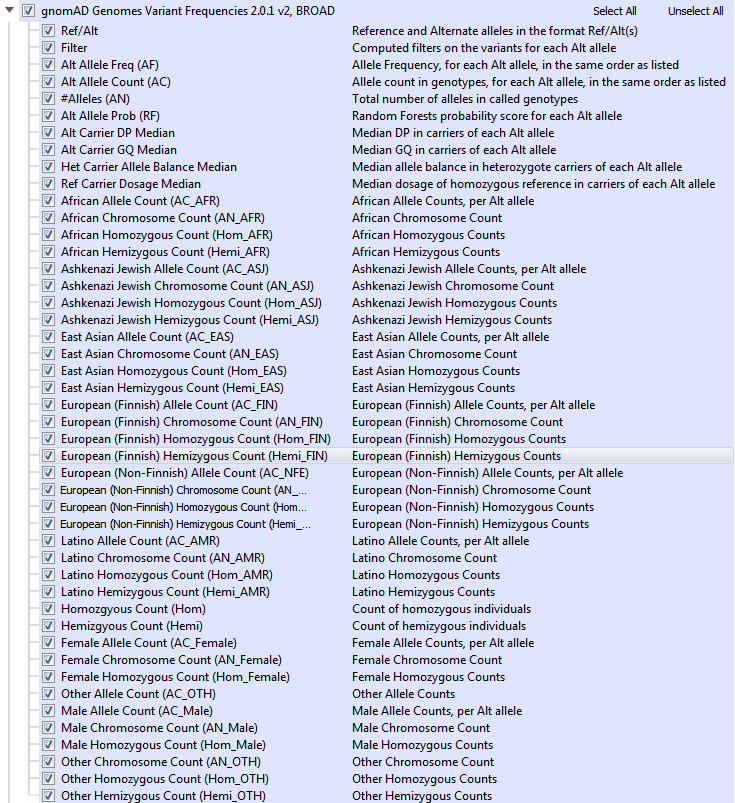
Fig 4b: gnomAD Genome Variant Frequencies.
Functional Predictions
dbNSFP
One powerful variant analysis approach is to predict the functional impact of each variant. DbNSFP is a database of functional predictions and annotations of all potential non-synonymous SNPs in the human genome. This track incorporates several functional prediction algorithms and conservation scores to help users assess the functional impact of a given variant. In VarSeq, there are multiple dbNSFP track options available including functional predictions and scores (>82 million variants)(Figure 5). Another dbNFSP tool available is an interval track with gene positions from Entrez and MEDgen info coming from OMIM and Human Phenotype Ontology (HPO) (Figure 6). The dbNSFP gene track supplies additional biological pathway data, functional descriptions, number of gene interactions, probabilities of haploinsufficiency, probabilities of a disease coming from a recessive gene, and much more!
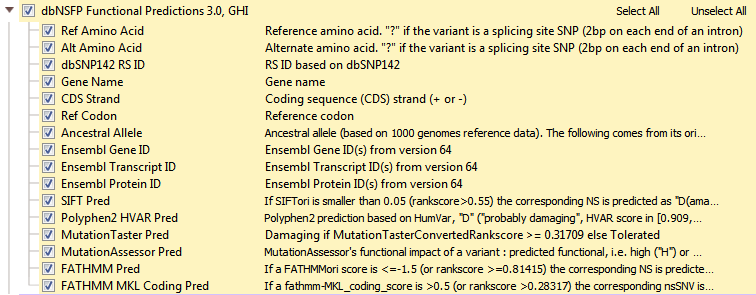
Fig 5: dbNSFP Functional Predictions database viewed in VarSeq: contains variant effect classifications from functional prediction algorithms such as SIFT, Polyphen, MutTaster, MutAssessor, FATHMM Pred, and FATHMM MKL.
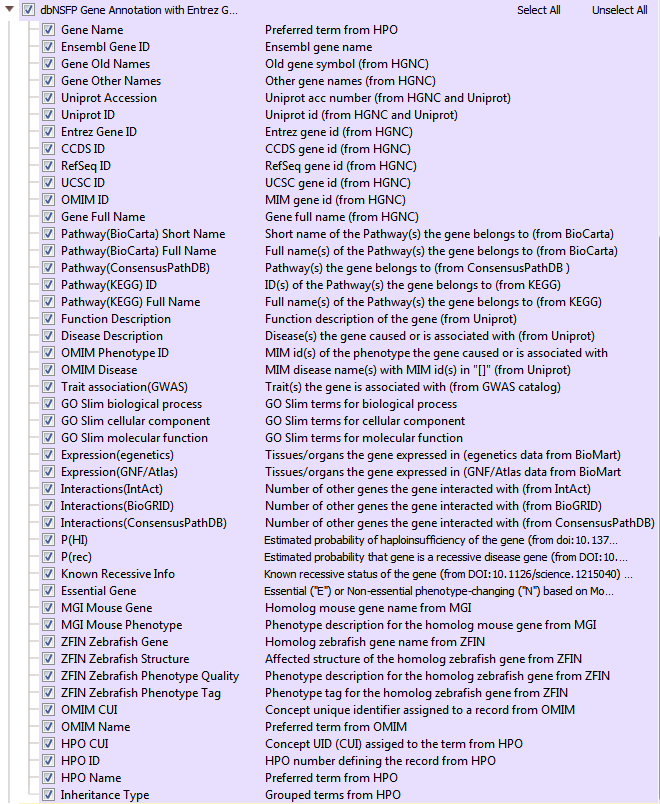
Fig 6: dbNSFP Gene Annotation (Entrez gene coordinates + MEDGen OMIM/HPO terms)
VarSeq incorporates the predictions in dbNSFP into a voting algorithm and reports the six different predictions per variant. Results from the voting algorithm can serve as an excellent tool when filtering out tolerated missense variants (Figure 7), or likely don’t have any negative functional impact.
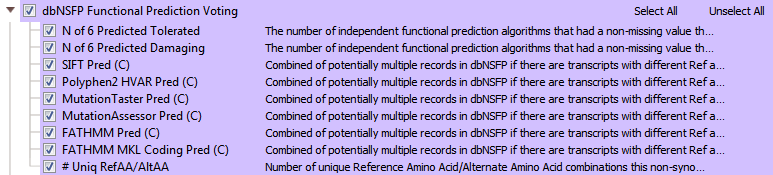
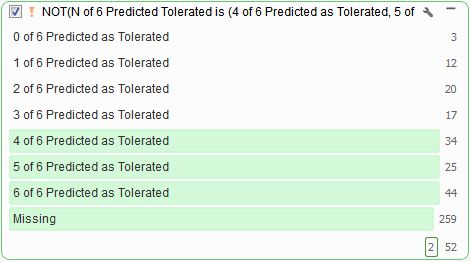
Fig 7: The results from VarSeq’s Functional Prediction Voting algorithm: you can use an inverted Predicted Tolerated filter card to remove variants with no predicted effect.
DbNSFP is a powerful tool for filtering down to variants that evoke a possible loss of protein function. However, a user may wish to focus on variants evoking a negative impact specific to splice consensus regions. Thankfully, we provide an additional annotation for this particular analysis case.
dbscSNV
The dbscSNV database contains over 15 million variants specific to splice consensus regions. Splice sites are the stable sequences around the intron/exon boundary that serve as a guide in the process of splicing exon transcripts to create mRNA. In dbscSNV, you can capture variants in regions -3 to +8 at the 5’ site and -12 to +2 bases at the 3’ end. Variations in the conserved sequence motifs at splice sites may result in abnormal gene splicing, leading to gene silencing or other detrimental effects. dbscSNV contains pre-computed prediction scores for all possible SNVs that may occur in splice consensus regions, indicating whether each variant is expected to affect the splicing of the gene. The two scores given for each variant are the “Ada” and “RF” scores (see Figure 8). These are ensemble scores, derived from the outputs of several machine learning algorithms. Both are scaled from 0 and 1, and higher values indicate a higher probability that the variant will alter the splicing of the gene.
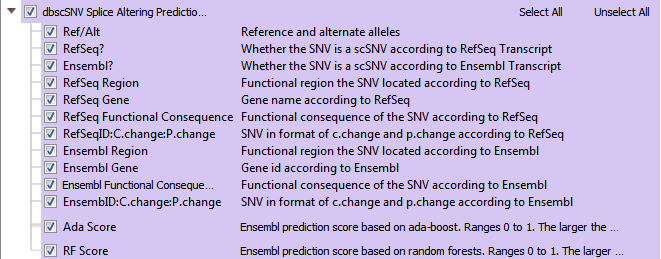
Fig 8: Dbscsnv Splice Altering Predictions: all RefSeq and Ensemble gene data and with Ensemble’s Ada/RF prediction scores
In addition to finding a functional impact of missense variants or splice site variants, we provide another annotation that can provide an assessment of the functional impact of insertions/deletions.
CADD
The Combined Annotation Dependent Depletion, or CADD, is a tool for scoring the deleteriousness of single nucleotide variants as well as insertion/deletions variants in the human genome. CADD can quantitatively prioritize functional, deleterious, disease causal variants across a wide range of functional categories, effect sizes and genetic architectures and can be used prioritize causal variation in both research and clinical settings. From the VarSeq perspective, CADD reports four fields:
- Ref/Alt: Reference and single alternate for this score in form Ref/Alt
- Raw CADD scores (C-Scores): while having no absolute unit of meaning, does have relative meaning with a higher score meaning a variant is more likely to be simulated (not observed) and more likely to have deleterious effect.
- PHRED score (scaled C-Score): range from 1-99, based on the rank of each variant relative to all possible 8.6 billion substitutions in the human reference genome.
- SNV at the 10% of CADD scores = PHRED score of 10
- SNV at the 1% of CADD scores = PHRED score of 20
- SNV at the 0.01% of CADD scores = PHRED score of 30
- Estimated?:
- True = if scores are estimates vs. direct CADD scores (for novel indels, score is estimated from flanking or deleted bases)
- False = if scores are directly from CADD with pre-computed 8.6 billion single letter substitutions + 20 million previously observed indels.
For frame-shifts, the maximum of all SNV scores for spanning bases for deletions or both flanking bases for insertions are used, while In-frameshift scores are the average for spanning or flanking bases. The description of this method was published in Nature Genetics, with a link provided here. Looking back, we’ve discussed some annotation types throughout this blog series, but it goes without saying that utilization of the appropriate gene track is fundamental for any variant interpretation analysis.
Gene Tracks – Transcripts
Every gene track available in VarSeq includes a transcript annotation algorithm. For the most part, we implemented our algorithm to closely match Ensembl’s Variant Effect Predictor’s behavior, with some additions to aid the clinical interpretation process. Not only do you get the gene information in where that variant resides, but also likely sequence ontology, functional effect on the transcript, and the relevant HGVS c. and p. notation. Now it is important to note that this transcript annotation algorithm is performed for every transcript in these databases. So, for genes that encode several transcripts, we provide a detailed per-transcript breakdown in our “details pane.”
RefSeq
RefSeq serves as our default gene track. NCBI’s RefSeq collection provides a comprehensive, integrated, non-redundant, well-annotated set of sequences, including genomic DNA, transcripts, and proteins. RefSeq sequences form a foundation for medical, functional, and diversity studies. They provide a stable reference for genome annotation, gene identification and characterization, mutation and polymorphism analysis, expression studies, and comparative analyses. The available fields in RefSeq within VarSeq, seen in Figures 9 a,b,c, are in three major groups: RefSeq Genes, Transcript Interactions, and some Auxiliary fields.
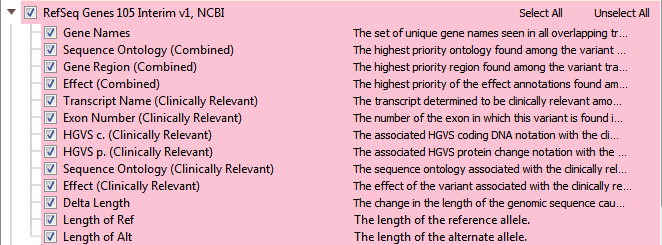
Fig 9a: RefSeq Genes: Summary of computed variant/transcript interactions. Reports the highest priority transcripts based on overall effect from combined transcripts and the clinically relevant transcript.
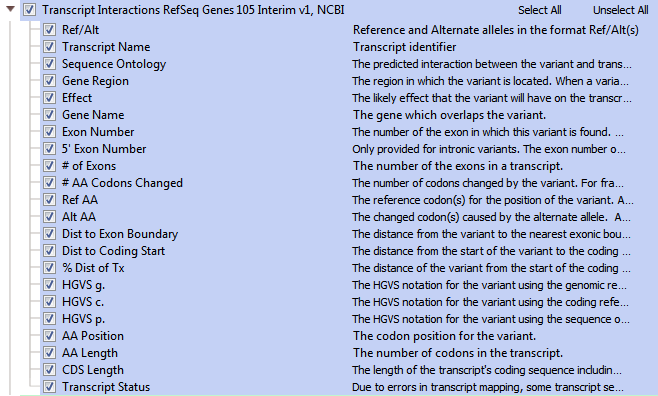
Fig 9b: RefSeq Transcript Interactions: Computed interactions between a variant and overlapping transcript, with useful statistics and HGVS notation for each variant/transcript pair.
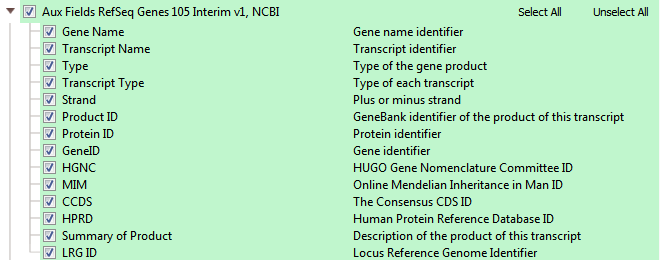
Fig 9c: RefSeq Aux Fields: List of various gene, transcript IDs, and summary of transcript product.
RefSeq will provide a list of all associated transcripts to any variant. The user then can choose to filter on the effect of these “clinically relevant” transcripts or use the transcript with the biggest impact out of all possible transcripts, or the Effect (combined) field (see figure 9a). You can view all the associated transcripts in a pleasant layout using VarSeq’s “Detail Pane” (see Figure 10). From this view, you can quickly read each transcript, their effect, the associated exon, HGVS notation, and many other fields.
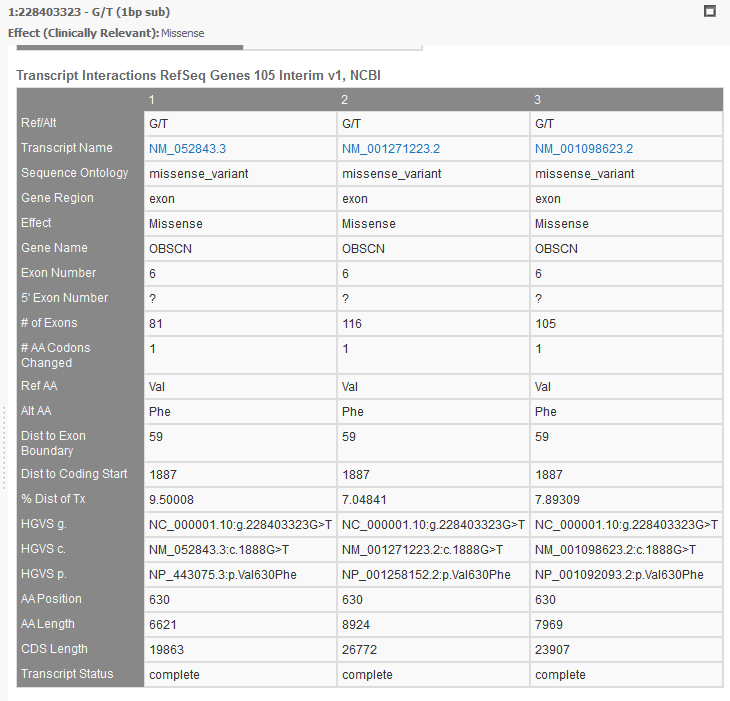
Fig 10: List of multiple transcripts for a single variant in VarSeq’s “details pane”.
The multi-transcript analysis you can achieve with RefSeq is also possible with other gene tracks in your Golden Helix software.
Ensembl
In addition to RefSeq, we also have Ensembl. The Ensembl project was a joint effort between the European Bioinformatic Institute and the Wellcome Trust Sanger Institute to annotate, analyze and display vertebrate genomes. Viewing the Ensembl data in VarSeq, you’ll notice it is very similar to RefSeq. However, this similarity does not limit its importance in your variant analysis. Synchronizing your variant/gene filtration with both Ensembl and RefSeq can add even more validation to your variant’s significance. As seen in Figures 11 a,b,c, Ensembl annotates genes, computes multiple alignments, predicts regulatory function and collects disease data.
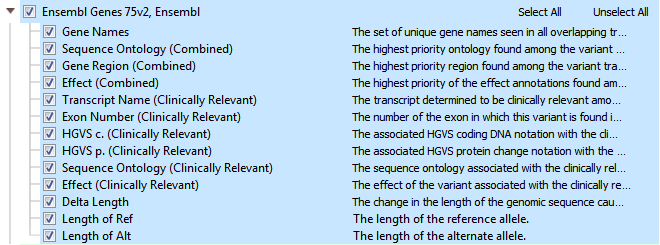
Fig 11a: Ensembl Genes: Transcript effects with associated notation and IDs.
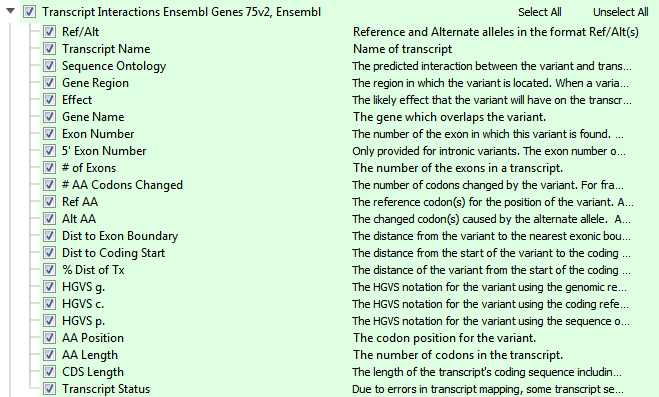
Fig 11b: Ensembl Transcript Interactions: With fields similar to RefSeq, Ensemble may have differing computed variant/transcript interactions.
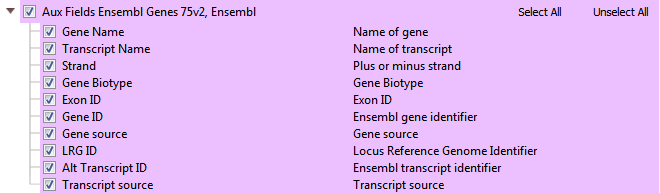
Fig 11c: Ensemble Auxiliary fields: gene and transcript IDs and sources.
Throughout this blog series, we have covered a wide variety of annotation types. While giving descriptions of these annotations by showing specific examples, this blog series is not a comprehensive list of the annotations curated by Golden Helix. The list of annotations we provide is substantially more extensive, and we would encourage readers to learn more about all the annotations available. The focus of this series is on variant interpretation/annotation, but we’ve also recently added additional databases for our users. To discuss more of our annotation capabilities, an extra blog in this series will soon be added that covers our CNV annotations in more depth.