The PhoRank tool in VarSeq is further explored in this post by looking at the sample-specific capability. VarSeq PhoRank Part: 1 Variant Phorank Gene Ranking showed how the PhoRank algorithm could be applied to all the variants in a VarSeq project, regardless of the number of (or difference in) samples. There is another PhoRank algorithm in VarSeq that allows the user to analyze different phenotypic associations independently between samples in the same project.
As a quick recap: the PhoRank algorithm in VarSeq is based upon the Phevor algorithm which quantifies the relationship between genes and phenotypes with score values. Moreover, with this application, a high score correlates to a strong relationship.
Now the Sample PhoRank Gene Ranking includes the same gene ranking that the Variant PhoRank Gene Ranking does but includes the option to analyze gene and phenotype relationships within each sample, and that means different phenotypic terms can be applied to each sample.
The sample-based PhoRank algorithm can be applied in VarSeq by first annotating your variants with a gene annotation source (such as RefSeq Genes which comes included with VarSeq) and then selecting Sample PhoRank Gene Ranking in the algorithm selection menu.
To use Sample PhoRank:
• Import your variants
• Annotate with a gene annotation source
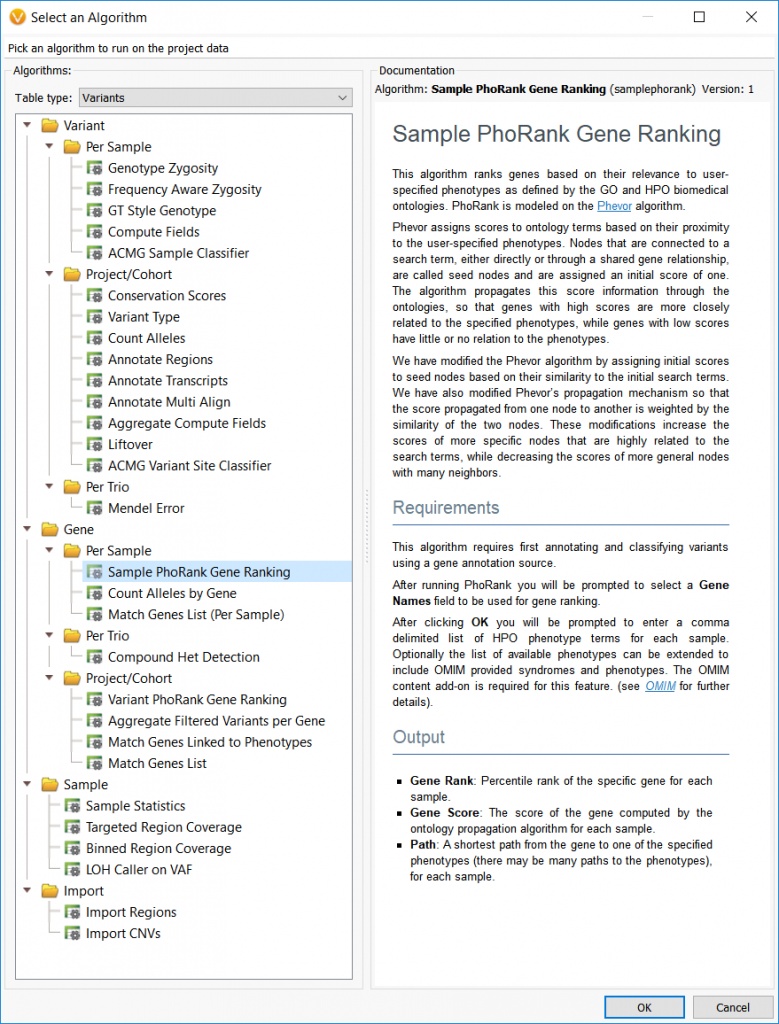
• Select Add > Computed Data… (see the dialog shown below)
• Select Sample PhoRank Gene Ranking under Gene > Per Sample
• Select Gene Source
• Input phenotype(s) list per sample
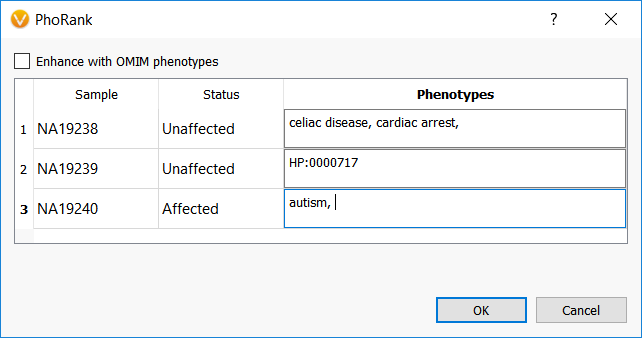
*Note: Recent updates to the PhoRank algorithm now allow users to directly use the HPO IDs in conjunction with phenotype names, where before only phenotype names were accepted. For example, you can type HP:0000717 instead of “Autism.”
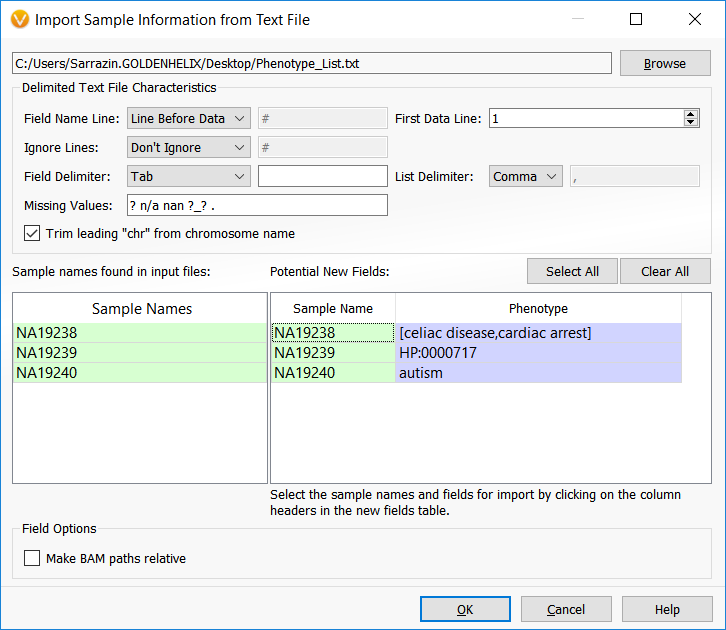
The image below shows the dialog that allows users to specify the phenotypic terms to analyze for each sample. This example is using a trio analysis project where the first sample listed has two phenotypes (celiac disease and cardiac arrest) to analyze. The following two samples actually have the same phenotype but listed once with the HPO ID and once with the common phenotypic name, “autism.”
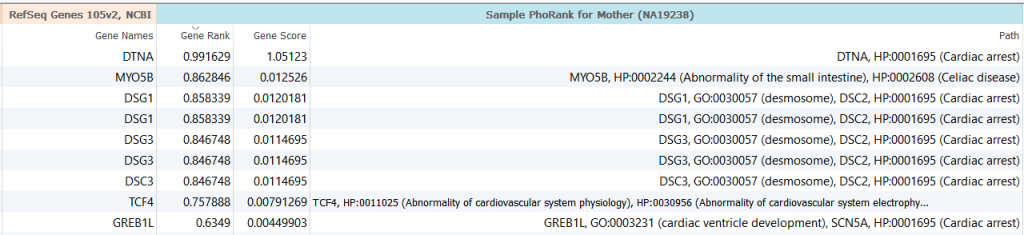
The output to running the sample PhoRank algorithm matches the variant PhoRank algorithm and provides the gene score, the gene rank compared to other genes, and the shortest path between the gene and one of the input phenotypes.
The results for the first sample listed above where two terms were entered show that the highest ranked gene is DTNA and is associated with the second term, cardiac arrest. The next entry in the list is for the gene MYO5B and is associated with the first term, celiac disease, so the algorithm sorts not only the gene-phenotype connection for each
The sample PhoRank algorithm also has the added feature to determine the phenotype terms to use in the analysis from a field list in the sample table. This can increase workflow ease by allowing sample and phenotype connections to be stored and adjusted in a text file.
A way to replicate the previous example would be to start with a text file that shows the sample names and the corresponding phenotypes in a simple list.
Sample Name Phenotype
NA19238 celiac disease, cardiac arrest
NA19239 HP:0000717
NA19240 autism
Then, this file needs to be associated with the sample data in VarSeq. This can be done using the import wizard on the “Samples” page when the project is being created or even after importing by using the Edit Sample Fields icon from the Samples tab in the VarSeq project.
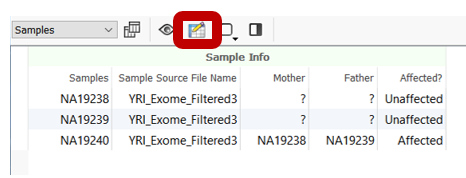
In either case, use the “From Text File” button to associate new fields with the samples in your project. Since the above text file example clearly denotes the Sample Name field and the Phenotype field titles, the program easily associates the sample information.
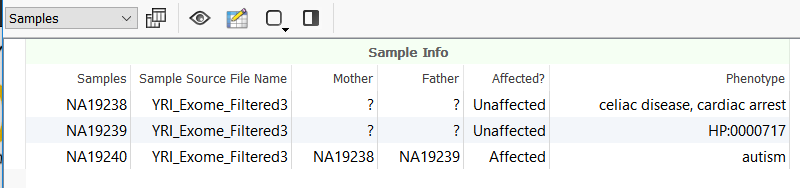
Moreover, this new field is added as a new column in the Samples table in VarSeq.
Whether the field association is done during the project creation, or later after importing, at this point running the Sample PhoRank Gene Ranking algorithm automatically fills in the Phenotypes field from the sample association. Any new sample associations can be made by adjusting the text file and then updating the sample association by repeating the steps from Edit Sample Fields in VarSeq.
Since the differences between the variant PhoRank and sample PhoRank analyses have been discussed, it should be noted that both algorithms will produce the same results if the same phenotypes are used.
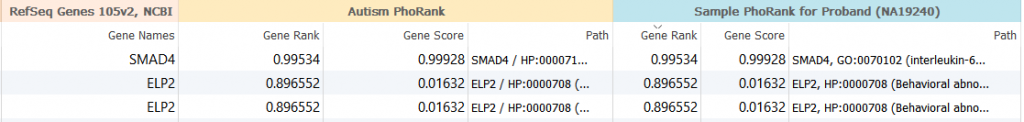
The results above are for the third sample that used the single term, “autism” and illustrate that the variant PhoRank algorithm results (under the peach heading “Autism PhoRank”) and the sample PhoRank results (under the blue heading “Sample PhoRank for Proband (NA19240)”) are the same since the same phenotypic term was used in the analysis.
Similar to its variant counterpart, VarSeq sample PhoRank can be used to narrow the field of available search variants by ranking the relevance between a certain variant and specific phenotype but on a per-sample basis, and is especially useful for the single exome and family trio analyses that clinical diagnosticians commonly face.
For any additional questions about sample PhoRank Gene ranking or VarSeq, please reach out to us and we would be happy to set up a one-on-one demonstration.