In this blog series, I will discuss the architecture of a state of the art secondary pipeline that is able to detect single nucleotide variations (SNV) and copy number variations (CNV) in one test leveraging next-gen sequencing. In Part I, we reviewed genetic variation in humans in general and looked at the key components of a systems architecture supporting this kind of analysis. Part II reviews briefly how algorithms such as GATK are leveraged to call single nucleotide variations. Part III will give you an overview of some of the design principles of a CNV analytics framework for next-gen sequencing data. Part IV will show some examples of how such a CNV caller will identify CNVs. Finally, Part V shows what an integrated clinical workflow looks like.
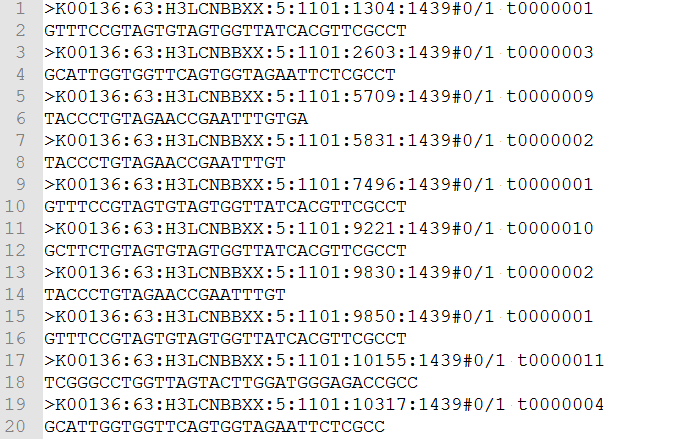
Figure 1: Example of an FASTQ File
To start things off, let’s take a look at the secondary analysis for SNVs. Sequencers take the physical sample and translate it into data – this step is referred to as primary analysis. The data output is called a FASTQ file (shown in Fig. 1), and it contains millions of reads varying in length from 50 to 250 base pairs which consist of A, C, G and T character strings. The sequencers also compute a quality score, or the so called Phred Score, for each base.
From there, the secondary analysis for SNVs begins with three discreet steps as outlined in Fig 2. The first step in the data processing is called Alignment. This process determines the most likely source of the genome sequence for the observed DNA sequencing read, given the knowledge of which species the sequence has come from. Today’s short-read alignment programs are generally used for the alignment of DNA sequence from the species of interest to the reference genome assembly of that species. This difference, although it initially seems subtle, has several consequences to the final algorithm design and implementation, which include letting assumptions about the number of expected mismatches be driven by the species polymorphism rate and the technology error rate rather than by considerations of evolutionary substitutions.
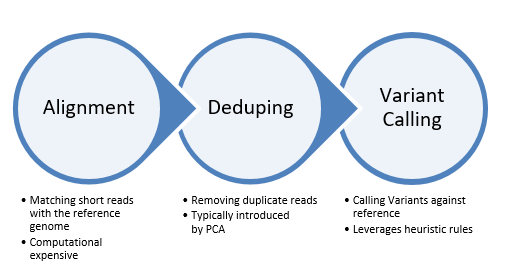
Figure 2: Steps of the secondary analysis for SNVs
In general, these assumptions allow for much faster processing, as few low-quality alignments are either expected or scored. Given the massive data volumes produced by the present sequencing machines, this has also allowed alignments to be calculated without a correspondingly massive increase in computer hardware requirements. As sequence capacity grows, algorithmic speed may become a more important bottleneck. Although there is a large and ever-growing number of implementations for short-read sequence alignment, the number of fundamental technologies used is much smaller. These are… to continue reading, I invite you to download a complimentary copy of my eBook. You can do so by clicking the button below.