As VarSeq continues its adoption amongst clinical labs and researchers looking for reproducible workflows for variant annotation, filtering and interpretation, we have continued to prioritize the addition of features to assess the quality of the upstream data at a variant, coverage and now sample level.
The Importance of Quality Assurance
Sample prep and sequencing problems are difficult to detect through the analysis of individual variants alone. Variant attributes used to measure quality such as read depth and alternate allele frequency only apply to that variant and the individual reads used to make the call. In order to detect low quality samples, metrics must be used that take all of the variants reported into account. This quick algorithm can be used to sanity check each sample by adding quality assurance statistics.
Requirements
Unlike the Coverage Statistics algorithm which requires BAM files, the Sample Statistics Algorithm can be run on any project with samples.

The Sample Statistics Dialog in VarSeq
Select outputs:
- Ti/Tv
- Coding Ti/Tv
- Variant Count
- Coding Variant Count
- Heterozygous Ratio
- Homozygous Ratio
- Gender Inference
The fields output by the Sample Statistics algorithm count the different types of variants and compute their relative ratios. This includes simple statistics such as the number of observed variants and variants in coding regions. As well as the ratio of heterozygous variants to homozygous variants. This ratio can also be applied to the X chromosome to determine sex of each sample.

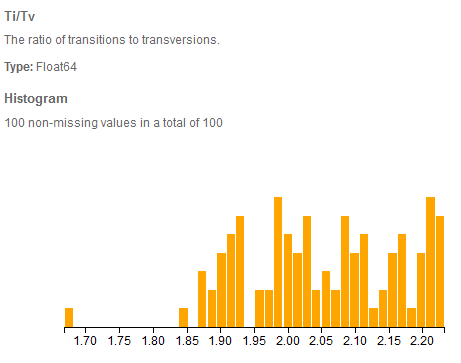
Ti/Tv distribution in VarSeq of 100 exomes called using GATK HC from the 1000 genomes project.
The Ti/Tv or the ratio of transitions to transversions is especially relevant for the analysis of whole genomes and exomes. This measure has shown to be relatively stable at about at about 2:1 for human genomes [1]. Interestingly this figure rises to approximately 3:1 for exomes. One theory for this is that transversions have more destructive effects [2] and thus through selective pressure are depleted in coding regions.
Without the selective pressure, random mutations actually favor transversions, so a low Ti/Tv ratio (below the expected 2:1 for genomes or 3:1 for coding regions) is a good indicator of having systematic sequencing or mapping errors and thus a likely high rate of false positive variant calls present in that sample.
Looking at all these summary statistics gives a broader context of the quality of the upstream stream analysis and sequencing. The new Quality Assurance Sample Statistics algorithm in VarSeq makes it easy to get an overview of the quality of each sample. If a sample’s statistics differ greatly from the average observed values, then that sample may warrant closer inspection and possible repetition of the upstream analysis.
If you have questions about the Sample Stats fields highlighted or any of the other algorithm outputs, don’t hesitate to contact us at support@goldenhelix.com.
References:
[1] Stephens, J. Claiborne, et al. “Haplotype variation and linkage disequilibrium in 313 human genes.” Science 293.5529 (2001): 489-493.
[2] Freudenberg-Hua, Yun, et al. “Single nucleotide variation analysis in 65 candidate genes for CNS disorders in a representative sample of the European population.” Genome research 13.10 (2003): 2271-2276.