Over the past 3 years, Golden Helix has analyzed dozens of public and customer whole-genome and candidate gene datasets for a host of studies. Though genetic research certainly has a number of complexities and challenges, the number one problem we encounter, which also has the greatest repercussions, is born of problematic experimental design. In fact, about 95% of the studies that we analyzed had major problems with the experimental design. Namely, some aspect of data collection or experimental order (i.e. plating) is not randomized with respect to the phenotypes of interest. The unfortunate result is endless struggles with spurious associations due to confounding, to the point, in fact, where real associations cannot be distinguished from experimental artifacts. This confounding only gets worse when two or more poorly randomized experiments are combined with the goal of increasing power through mega-analyses. A timely example can be found in the flaws revealed in the recent Sebastiani et al. Science paper, “Genetic signature of exceptional longevity in humans”, which appear to result almost entirely from the analysis not taking into account batch-effect driven spurious associations.
How is it that this easily avoidable problem is almost universal? We’ve seen poorly designed experiments come out of some of the top GWAS research centers in the world. We have been sounding the alarm with increasing intensity over the past couple of years, and I recently spoke on this topic at the CSCDA conference in Belgium in the context of CNV analysis.
Example from the Wellcome Trust Case Control Consortium
Consider the famous Wellcome Trust Study that some say started the golden age of GWAS, (“Genome-wide association study of 14,000 cases of seven common diseases and 3,000 shared controls“, Nature 2007). The consortium performed the genotyping for the two control populations in two distinct sets of plates, and each of the various disease studies in their own separate set of plates.
The question that comes to mind most often is why, if this is a problem, are the study’s Manhattan plots so clean? This is because the Manhattan plots included in the paper are the result of careful manual curation and are the result of discarding of hundreds of spurious associations.
As an example, before SNP quality control, the Manhattan plot of Type I diabetes cases vs. the National Blood Service controls looks like this:
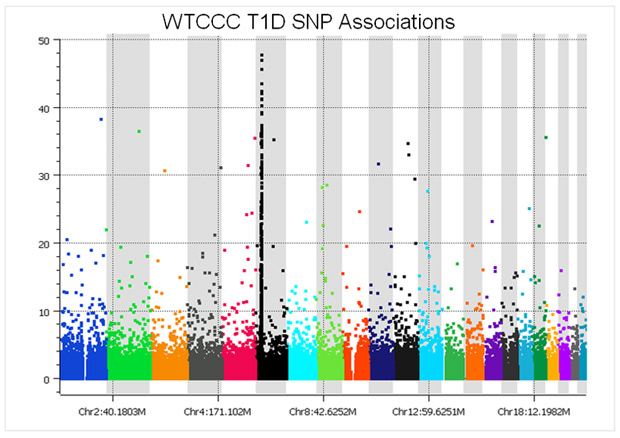
At a glance, the plot might not seem too bad – there is a nice peak in the HLA region of chromosome 6, plus several associations in the upper portion of the graph. However, considering that a p-value of 5e-8 is regarded as the threshold for genome-wide significance, it is clear that there are easily over 100 spurious associations. These associations are directly due to the measurement error varying between the cases and the controls because they were run in different batches, versus block randomizing the seven sets of cases and common controls across all of the plates.
To resolve this, the analysts devised a set of clever filters for dropping the SNPs that were most likely to have spurious associations. Filtering, for instance, on-call rate, Hardy-Weinberg equilibrium, minor allele frequency, and so forth. This was an appropriate strategy given the money had been spent on the experiment and the samples had already been genotyped. However, if the experiment had been properly randomized, no filters would have been necessary. Unfortunately, this band-aid practice of applying filters to SNPs has been followed in GWAS publications ever since, instead of addressing the problem at its source – the experimental design.
Some might say that filters solve the problem. However, this is not so. Not only must some SNP studies drop 30% or more of the SNPs, but haplotype and gene-gene interaction analyses often surface additional spurious associations even when stringent filters are applied. This gets worse with imputation and mega-analysis projects.
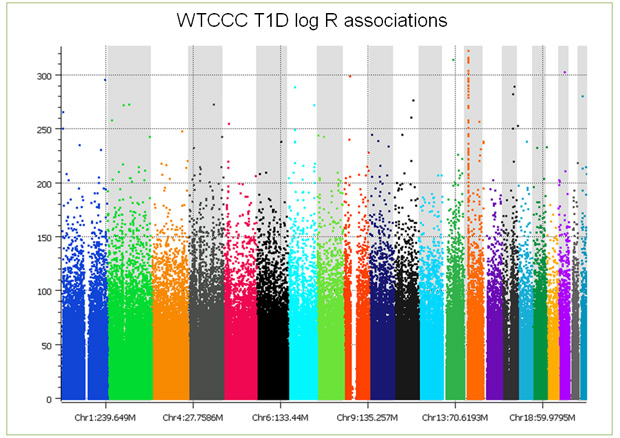
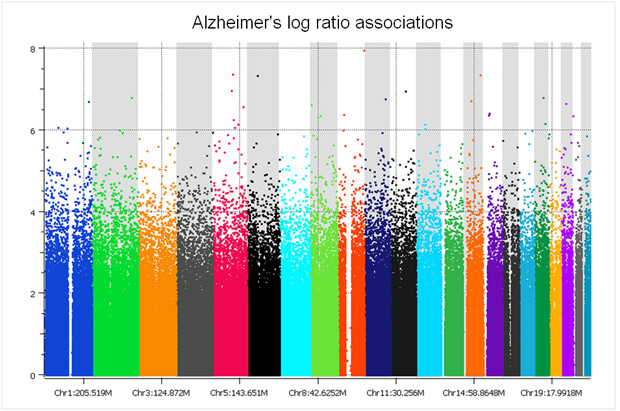
But that’s not the end of the story; things get worse still when you examine the copy number intensity data. When association tests are performed on the log ratios, you see the entire genome covered with false positive associations (see plot below), making copy number analysis problematic at best. With CNV analysis, no amount of filtering can remove batch effects. We have developed a number of approaches including principal components correction to treat the problem, however, there always remains confounding that can just not be fixed. Further, these batch-based differences, while alleviated somewhat, do not go away by making discrete calls by averaging across multiple consecutive markers in a copy number region. (As you examine this plot, keep in mind that 5e-8 is considered significant, a point just below the first tick mark on the Y axis.)
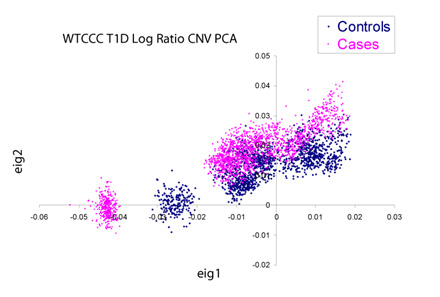
If we dig into this further by performing a principal components decomposition of the covariance matrix of the copy number data, we see there is significant non-random structure in the data both with and between the case/control data set. Pictured below are the cases and controls plotted against the first two principal components of the matrix. Devoid of plate-to-plate variation, these clusters should overlap perfectly and be virtually indistinguishable from each other.
A few years later, the Wellcome Trust reran their samples, this time with specialized copy number arrays. Unfortunately the same type of mistake was made again, but with a twist: they put two diseases on each plate instead of block randomizing all eight of them along with their controls (see supplementary information 1 for “Genome-wide association study of CNVs in 16,000 cases of eight common diseases and 3,000 shared controls”, Nature 2010). The authors’ rationale for their “phased randomized cohort screening” was not about controlling for sources of variability, but rather as a way to get some studies done earlier (including all of the controls) to “facilitate piloting of data analysis pipelines”. When this design was described to a Fellow of the American Statistical Association, he was shocked that such a reputable organization could possibly make such a fundamental experimental design error. Is it any wonder many copy number studies are coming up empty other than some success stories of finding very large rare variants spanned by dozens to hundreds of markers? (Yes, there are other reasons too, but that is the topic of my last blog post.)
Why does this travesty continue?
One would assume that if researchers just knew better they would do better, and I believe this to be so. However, why is knowledge of design of experiments (DOE) not universal? DOE is not a new field. Heck, Fisher founded the field of experimental design in 1935 in his book, Design of Experiments. Scientists run experiments for a living; one would presume they have been schooled in the need to control for sources of variability when running an experiment. GWAS studies are just another experiment. Have scientists made an exception for GWAS and thrown design of experiments principles out the window? Or do they just not know what the biggest sources of variability are and thus don’t know how to randomize for them? Or did industry’s promise of 99% genotyping call rates just lead researchers to conclude that accuracy is assured and experimental variability is, therefore, a non-issue?
As I’ve traveled around the world and spoken with statistical analysts, I often feel I’m preaching to the choir. They readily agree and proceed to tell me how they are never asked to help with the design before the experiment begins, only asked to clean up the mess after millions have been spent. I can only conclude, at least where the rubber hits the road with the wet work, many scientists are woefully inadequately trained in the design of experiments. I also think that in some cases the problem stems from the division of labor in genotyping centers (the person that plates the samples is not the one that processes them, who is not the one that analyzes the data, and negative feedback never makes it back up the chain). I look back to my own education and cannot recall ever being formally taught DOE. I was just fortunate enough to be given on-the-job training while a graduate research assistant at a pharmaceutical company.
What does a good design of experiments look like?
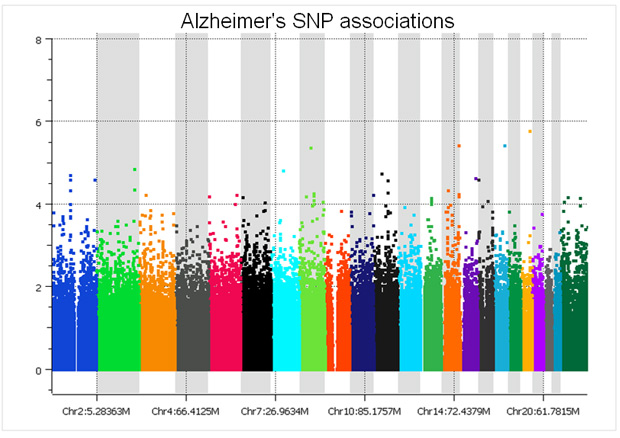
There are only two studies we have analyzed that did a proper randomized block design across plates – the GenADA Alzheimer’s study from GlaxoSmithKline and nine medical centers from Canada, presumably done by clinical trial statisticians well versed in design of experiments; and a large Parkinson’s study for which a Golden Helix statistician, Greta Peterson, designed the randomization scheme (“Common genetic variation in the HLA region is associated with late-onset sporadic Parkinson’s disease”, Nature Genetics 2010). In both studies, spurious associations due to plate effects were negligible. The following Manhattan plot for the Alzheimer’s study was clean without filtering a single SNP!
The copy number log ratio associations were nearly as clean, despite the potential confounding of DNA contributions from 10 different sites. To really understand the difference, compare the Y axis of the below plot with that of the previous T1D log R plot.
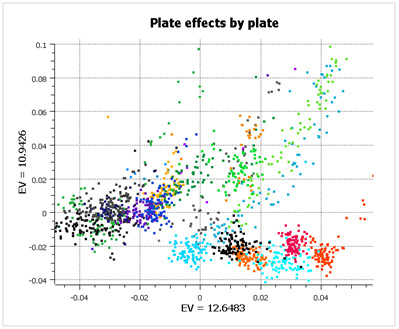
What is striking about this data is that there are large plate effects, but the point is that these plate effects are random with respect to case/control status and so don’t show up as significant during analysis. If you look at the first two principal components of the data (below), color-coded by plate, you see very clear clusters, caused entirely by plate effects (not population stratification).
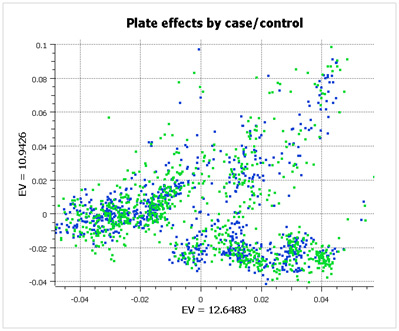
However, when you look at the same data color-coded by case/control status (below), you see that the data has been properly randomized. Each plate cluster contains equal proportions of cases and controls, eliminating spurious associations due to plate effects.
How to do it right
When plating samples, we strongly recommend a randomized block design. Below is an example illustrating the concepts by which we designed the plate layout for a 4,000-subject Parkinson’s study run on an Illumina HumanOmni1-Quad_v1-0_B platform.
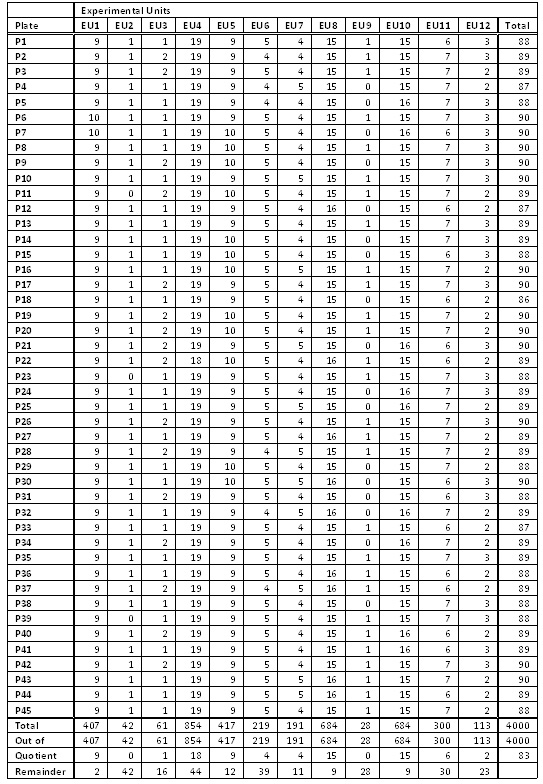
The study had 2,000 cases and 2,000 controls collected from four different sites using three DNA extraction methods. What could have been an experimental nightmare was actually not difficult to manage. We considered various design options, including randomizing on additional variables such as gender and age. The following table illustrates a block randomization involving case/control status, site, and DNA extraction method. Each row of the table contains counts of the various experimental units to be randomized across plates. The randomization ultimately employed in the study was somewhat more extensive, involving additional experimental units, but this illustrates the general concept of block randomization.
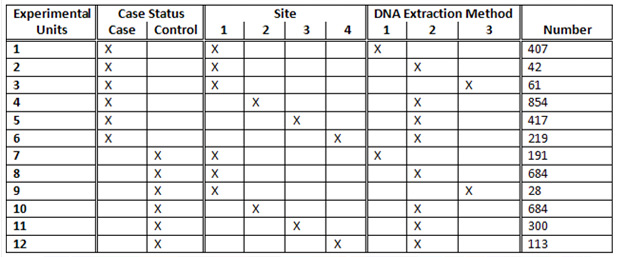
The case/control status is the most important variable to randomize. With quantitative traits, some form of discretization into experimental units can be employed. While plating will not remove the confounding due to the non-ideal data collection of different numbers of cases and controls by site and DNA extraction method, we can at least ensure these will not be further confounded with plate artifacts. That is, if we need to correct for data distortions due to site or DNA kit later, those can be done with a handful of dummy variables in a logistic regression, rather than an untenable cross-product of 45 plate variables with those dummy variables. (In an ideal world we would be able to block design the data collection as well, but often an experimenter must take the data as it comes.)
How does this table translate to plating? The 407 samples from Experimental Unit 1 containing cases from Site 1 with DNA Extraction Method 1 would be evenly divided at random among the 45 plates, resulting in either nine or ten samples per plate (never off by more than one, see the “EU1” column in the below table). We similarly divide Experimental Units 2 through 12 to construct 45 plates with 90 samples or less (see figure below). The remaining six wells on each plate were reserved for a male and female control sample and four other replicates.
Note that it is not sufficient for good experimental design to randomly place cases and controls on plates — it is key that the randomization is controlled so that the experimental units are almost perfectly balanced. We have seen studies that placed the samples at random, with many plates by chance alone being quite unbalanced and thus creating spurious plate-driven associations.
As mentioned above, the results of block randomization were clearly evident once the samples were processed. The Manhattan and Q-Q plots were excellent, and the inevitable plate-based experimental artifacts did not confound the results. Again, without filtering a single SNP for low call rate or departures from HWE, there were essentially no spurious associations (data not shown). The publication actually did apply standard SNP quality filters; but they were really unnecessary other than to follow convention. With proper DOE one can go back to manually inspecting and applying thoughtful scientific inquiry to the handful of extreme values to see if they are real or artifacts, rather than resorting to automated filters. We would like to note that it is entirely possible to have your genotyping center work with you on getting a good plate layout; CIDR was extremely cooperative and helpful in running the experiment with our final design. We’d also like to acknowledge Haydeh Payami for her vision in allocating the resources up front on the experimental design to improve the outcome of the study.
Closing thoughts
The bottom line is we need to stop the inefficient usage of taxpayer money inherent in running large-scale genetic studies without proper DOE. Perhaps it is time for the NIH to set forth policy on this before further money is wasted. Perhaps grant reviewers should insist on experts in experimental design being involved before the experiments are run. It most certainly is time for every field that calls itself a science to devote teaching time to the theory and extensive hands-on practice of design of experiments. And then my head will not explode!
…And that’s my two SNPs.
Fantastic post, Christophe.
In practice I suspect the major driver for non-randomisation of samples across plates is simple logistics: when your cases and controls arrive in separate plates, it’s easier to just leave them there rather than risk the potential hazards of moving samples around (namely, large-scale scrambling of samples relative to IDs and case-control status). When faced with the already daunting logistics of running a large GWAS, it’s tempting to avoid this additional source of complexity. However you make a pretty compelling case here for making the effort required for full randomisation; hopefully the right people are listening!
Thanks, Daniel. I agree logistics is an issue. I really wonder what the major driver is. You could be right that it is a matter of inconvenience and risk of mixup. On the other hand I heard the other day from an organization that reran a gene expression study to validate an academic study that was badly executed in terms of design (non-random plating, switching array platforms midstream, cases and controls with different ethnic mixes through sample collection biases). The second study proceeded to run the cases and controls on separate plates, despite the expert being well aware of experimental design — he just didn’t think to do it. I think people segment the lab work in their minds as something they send off to other experts to do, and unless they’ve experienced the pain of bad design several times, they don’t change practice. Sometimes that is still not enough. The fact that experiments keep getting done this way by the same people indicates they take it as a fact of life that there are batch effects and perhaps just don’t know a better way. It would be an interesting poll for someone to do to drill into the reasons for this madness.
Pingback: Tweets that mention Stop Ignoring Experimental Design (or my head will explode) | Our 2 SNPs… -- Topsy.com
Wish you could increase the awareness of the importance of experimental design.
As a core lab director, I always recommend controlled-randomized-plating for genotyping projects. Although almost all my customers took my advice (at least tried to), not all would describe how the samples were plated in their papers. The importance of experimental design is often overlooked, especially when people think fancy statistical tools could do the magic work to clean up data and fix problems.
It is heartening that core labs like yours are making these recommendations. We are the makers of those “fancy statistical tools”, and absolutely agree with you that you can’t count on them to magically fix the data from bad design. Sure we can keep treating the condition, but the benefits of prevention are huge.
Some might say that these concepts are nice in theory but in practice people are going to merge datasets anyways with mega-analysis. If two studies are randomized properly and have equal proportions of cases and controls, a mega-analysis becomes seamless. Borrowing controls only will of course continue to be problematic.
OK, I’ll rise to the bait. Absolutely agreed we should all do this better. But let’s talk pioneering:
First part true – due to the arrival of samples over a more than one year time period, the control samples were separated – and the second part not, on the whole. The intended design of WTCCC1 – though sometimes frustrated by logistics – was more or less that used in the CNV paper of 2010. One reason for this imperfect design, and which may not be obvious from this distance, is that we didn’t know if the GWAS chips would work. At all. Certainly other pilot plates done with other technologies at the same time did not. Therefore the pragmatic decision was taken to push through samples where the DNA came from cell lines, in order not to squander irreplaceable samples on unproven technology. I wasn’t privy to the CNV paper’s decisions, but I’m guessing that something similar was being attempted.
Some of those responsible for the WTCCC1 plate design, such as it was, had worked on this beast:
http://www.ncbi.nlm.nih.gov/pubmed/16228001?dopt=Abstract
Clayton, D.G. et al (2005)
Population structure, differential bias and genomic control in a large-scale, case-control association study
Nat Genet. 37(11):1243-6
Here, despite heroic attempts to randomise plates,
OK – genotype calling has improved in the interim. But maybe you don’t need the filters now, because the SNPs that don’t work so well on varying sample sources have been removed – when we started WTCCC1 only 60 fantastically-good-quality-HapMap-CEU samples had ever been typed on the chip, at least that Affymetrix would show us. If that hypothesis is true, we can expect some ghastly artifacts from the new every-SNP-you-can-type custom chips coming out of Illumina.
Thanks for your thoughtful comments, Neil. I just created a plot of the log ratio PCA analysis color coded by disease for all of the samples from the original WTCCC study, and indeed it does look like there is partial overlap in the clusters between various diseases, rather than completely different plates as I had assumed. It is nice to have the historical reasoning on conserving scarce DNA.
The spurious-association-free example I showed of the Alzheimer’s study was the same array platform as the WTCCC study, the Affymetrix 500k array. I also used the same genotype calling algorithm, CRLMM, to call both studies for the SNP association plots. No matter how good the genotyping is, we see spurious associations if randomization is neglected. We still need to use SNP filters on the most up to date Affymetrix and Illumina arrays (without DOE), and I think the promised high quality of these experiments has lulled many into a false sense of security that there somehow are not batch effects and we don’t have to worry about randomization.
Randomization on plates will not fix earlier confounding in data collection and data preparation. The observation in the Clayton paper of clusters shifted by case/control status despite the heroic randomization attempts might be accounted for by the independent collection of case and control samples. They also state that the DNA was prepared in two different laboratories (albeit using the same procedure). It is not clear how the cases and controls were divided among those laboratories.
The samples were collected separately, and DNA extracted separately – the projects were only related in that our funders (Wellcome Trust and Juvenile Diabetes Resarch Foundation) knew that control samples would be becoming available when we started collecting cases, and WT then paid for immortalisation of control samples, knowing they had funded case collections. There are no PIs in common between the two sample sets.
Therefore, yes, the differences in clusters was down to the independent collection of case and control samples. This was unanticipated at the time.
There is a timely paper out this week:
http://www.ncbi.nlm.nih.gov/pubmed/20838408?dopt=Abstract
Leek, J.T., Scharpf, R.B., Bravo, H.C., Simcha, D., Langmead, B.,
Johnson, W.E., Geman, D., Baggerly, K., Irizarry, R.A. (2010) Tackling
the widespread and critical impact of batch effects in high-throughput
data. Nat Rev Genet, 11 (10), 733-739.
The paper is well worth reading, thanks for pointing it out! Hopefully with enough voices on this topic, the practice of experimental design in our field can be swiftly improved. Having that published stake in the ground is an important step.
Your article was cited by Stan Young on my current blogpost. I’m wondering if you have an update on the issue of randomization in microarrays. Thanks. D. Mayo
I co-authored an invited editorial in Biostatistics last year that built upon this blog post, “Learning From Our GWAS Mistakes: From experimental design to scientific method”. This blog entry: https://blog.goldenhelix.com/?p=1043 expands on the article and points to it. You can find some citations to this article here: https://www.researchgate.net/publication/221785571_Learning_from_our_GWAS_mistakes_from_experimental_design_to_scientific_method where, for instance, one group has developed a tool to better randomize microarray experiments.
Christophe: It’s an excellent article, not only for its astute explanation of these issues but also because of its links to philosophy of science–my field. I’m writing on this in a book, so I’m wondering if there’s an update since that. Thanks so much. I will cite your articles.